Data has been a word for a very long time. In an age of 2.5 quintillion bytes of data generated daily, data plays a vital role in business decision-making. Data analysis is an essential practice of modern businesses. Choosing the right data analysis tool is a challenge as no one tool covers all needs. The purpose of data analysis is to interpret, evaluate and organize the data and make the data presentable. Getting started with data analysis can seem daunting, and the sheer choice of tools available doesn’t help. So, here is a list of the ten best data analytics software, based on their performance, learnability, and popularity.
1. Microsoft Excel
You can use Microsoft Excel as software to improve your data insights. Microsoft Excel, one of the most widely used tools for data analytics, offers users options like sharing workbooks, working on the most recent version for real-time collaboration, and uploading data directly from a photo to Excel, among others.

2. Microsoft Power BI
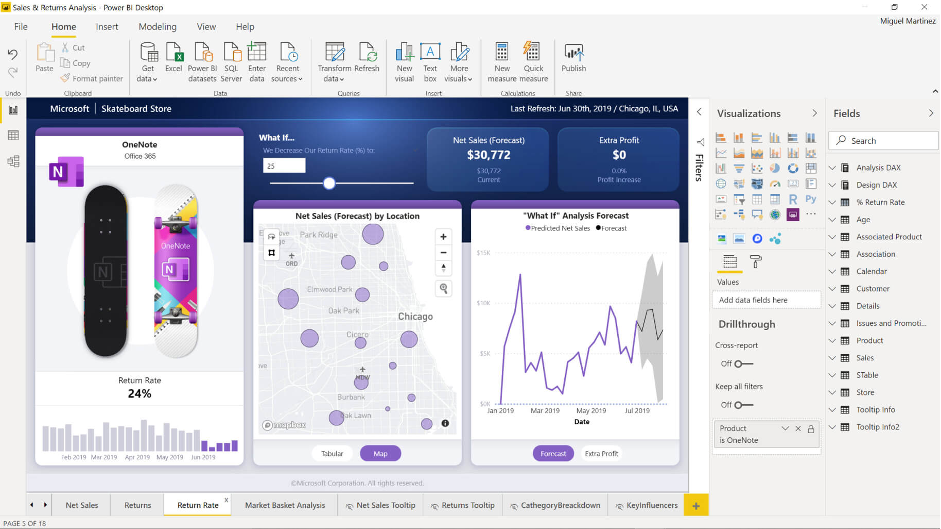
One of the best business intelligence platforms, Microsoft Power BI, supports many data sources. This tool allows users to create dashboards, visualizations, and reports. For simple deployment, users can combine multiple dashboards and information into a Power BI app. Users of Power BI can connect to Azure Machine Learning and build automated machine learning models.
3. R Programming
R is a popular statistical and data modeling program that is the industry’s top analytics tool. Data can be exploited and presented in a variety of ways. In many areas, including data capacity, implementation, and results, it has surpassed SAS solutions adapted to work with big data by installing all packages based on user needs.

4. Zoho Analytics
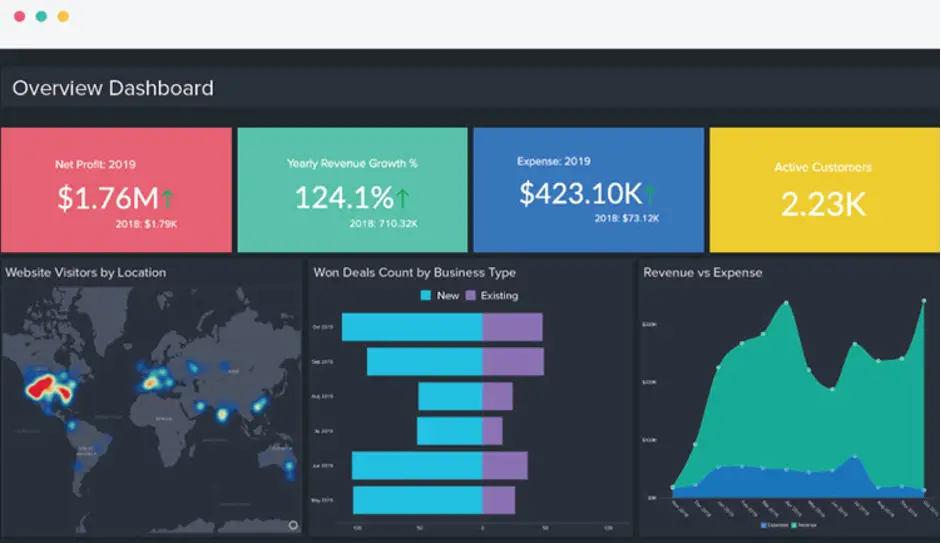
You may analyze data effectively and economically using Zoho Analytics. You may use Zoho Analytics to get your data examined no matter where it is. In terms of providing many different data visualization tools, Zoho Analytics excels. Utilize its AI-powered assistant, which enables users to ask inquiries and receive insightful responses in the form of pertinent reports.
5. RapidMiner
The tool on our list is RapidMiner. RapidMiner is a platform for data processing, developing Machine Learning models, and deployment that has been recognized as a Visionary in the 2020 Gartner Magic Quadrant for Data Science and Machine Learning Platforms. RapidMiner released RapidMiner 9.6, expanding the platform to include full-time programmers and BI users. It is an open, end-to-end data science platform that makes it possible to prepare data and use machine learning and operating models.
6. Sisense
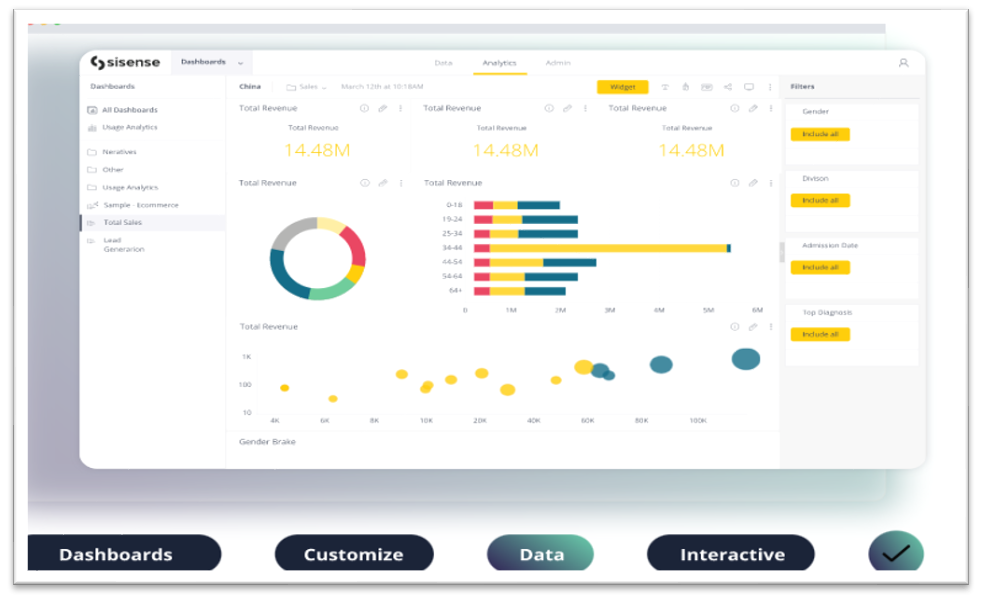
Technical developers and business analysts can use the data analytics platform Sisense to process and visualize all of their company data. It offers dynamic dashboards for teamwork and a selection of drag-and-drop features. The custom In-Chip technology of the Sisense platform, which optimizes computation to use CPU cache rather than slower RAM, is a distinctive feature. The calculation may be 10–100 times faster for various workflows.
7. SAS
SAS is a leader in analytics and offers a programming environment and language for data manipulation. In the 1980s and 1990s, it underwent significant development by the SAS Institute. SAS is simple to use, manageable, and capable of analyzing data from any source. These are now commonly used for customer and prospect profiling. Additionally, it can monitor and optimize communications and predict their behaviors.
8. Intrgrate.io
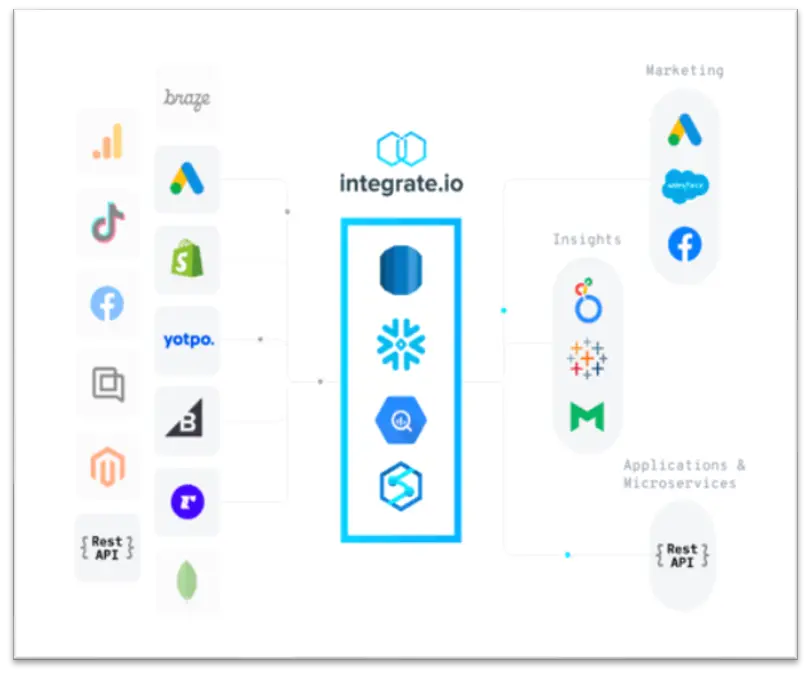
A cloud-based data integration and ETL solution are available from Integrate.io. With the adherence to compliance best practices, it offers transformation capabilities that assist with cleaning, normalizing, and transforming their data. You will be able to build visually appealing data pipelines to your data lake or warehouse.
9. Apache Spark
An open-source cluster computing platform for real-time processing, Apache Spark is one of the Apache Software Foundation’s most popular projects. It has an open-source community and a programming interface and is now the most active Apache project. This interface ensures implicit data parallelism and fault tolerance.

10. Tableau
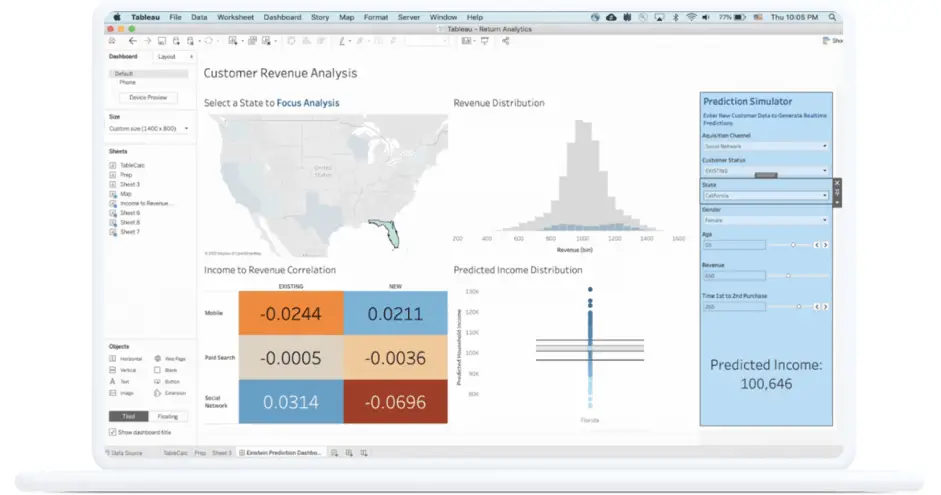
Create reports and share them across desktop and mobile platforms, in a browser, or embedded in an application using the data visualization and analytics platform Tableau. It can operate locally or on the cloud. Tableau’s query language, VizQL, powers a portion of its platform. It reduces the requirement for end-user performance improvements by converting drag-and-drop dashboards and visualization components into effective back-end queries. Tableau does not, however, enable complex SQL queries.
