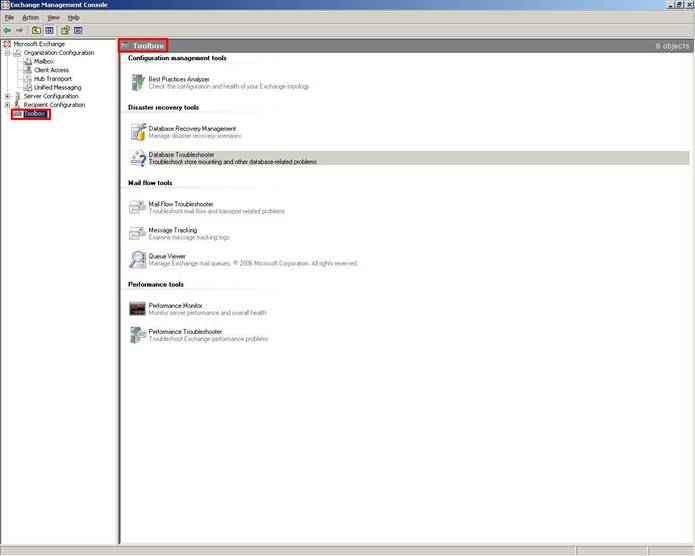
The Exchange Toolbox
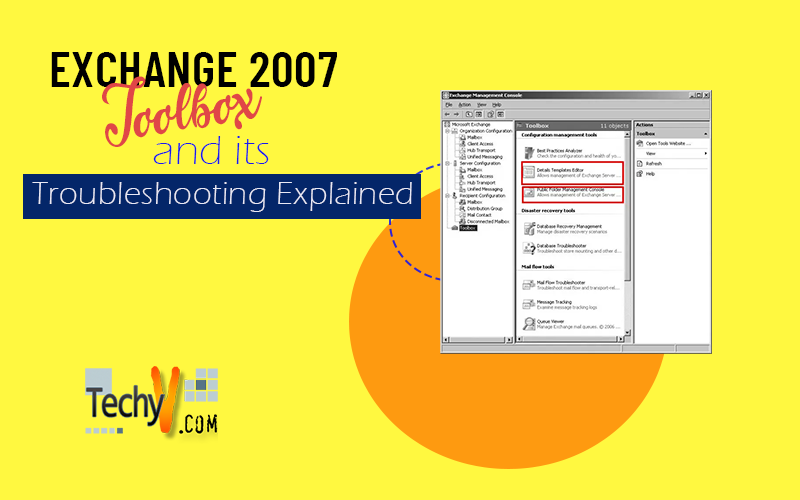
The Toolbox (Figure below) is the bottom node in EMC and serves as a container for a set of utilities that deliver lots of value for Exchange administrators. Some of these utilities (such as ExBPA and ExTRA) are available from Microsoft in standalone versions so that you can run them against Exchange 2003 servers and some of the options presented are simply signposts to utilities that already exist on the server.
Not all the tools here are specifically for troubleshooting, and they are separated into four different sections:
Configuration Management Tools
• Best Practices Analyzer
• Details Templates Editor
• Public Folder Management Console
Disaster Recovery Tools
• Database Recovery Management
• Database Troubleshooter
Mail Flow Tools
• Mail Flow Troubleshooter
• Message Tracking
• Queue Viewer
• Routing Log Viewer
Performance Tools
• Performance Monitor
• Performance Troubleshooter
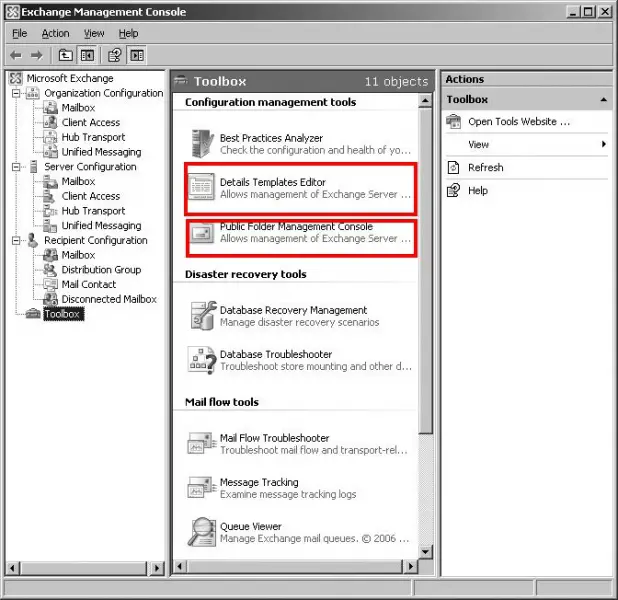
Exchange 2007 SP1 Toolbox comes along with the addition of 3 tools
• Details Templates Editor
• Public Folder Management Console
• Routing Log Viewer
Which was not available in Exchange 2007 as seen from the screenshot below.
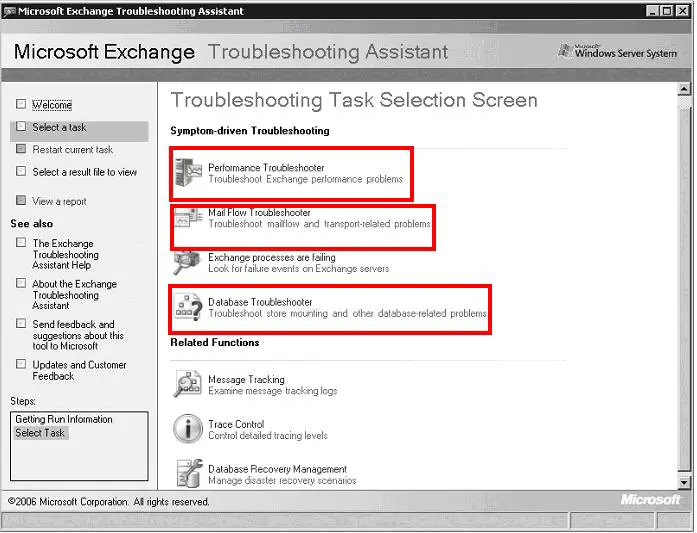
The Exchange Troubleshooting Assistant, shown in Figure above, divides the list of tools into two sections, as follows
Symptom-Driven Troubleshooting
• Performance Troubleshooter
• Mail Flow Troubleshooter
• Exchange processes are failing
• Database Troubleshooter
Related Functions
• Message Tracking
• Trace Control
• Database Recovery Management
The three “Troubleshooter” tools listed launch the Exchange Server Troubleshooting Assistant, shown in above Figure .This is another portal just for the troubleshooting tools and Adds a couple of other tools:
• Process Failure Analysis
• Trace Control
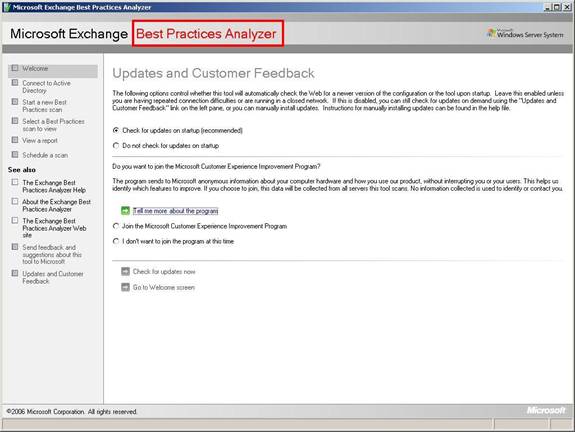
ExBPA is one of the most relevant applications for Exchange configuration, maintenance, and troubleshooting we have seen. Every Exchange administrator should at least be familiar with. It can be run proactively to identify potential problem spots as well as reactively when something is preventing optimized Exchange performance.
ExBPA depends on a configuration file called ExBPA.config.xml for its actions and calls on various components to collect data about the Exchange implementation, including the
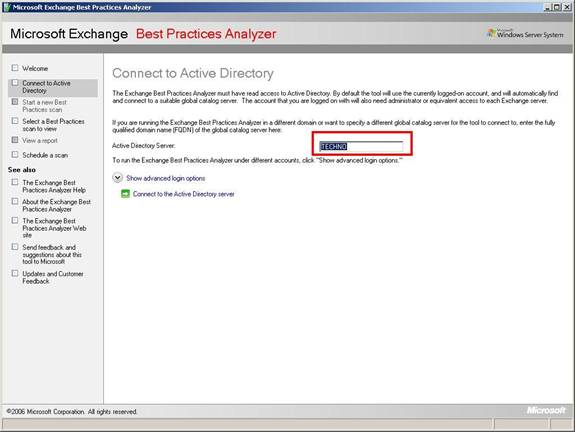
IIS metabase, Active Directory, WMI, and the local Exchange server.Starting the ExBPA returns the welcome screen shown in Figure and then offers an opportunity to enter an account with access to Active Directory after checking for updates. The minimum permissions required for the account executing ExBPA are threefold: domain administrator for AD queries, local administrator on each Exchange server, and Exchange View-Only Permissions on the Exchange organization. If the account running ExBPA has these permissions, the account option to access AD is not necessary. After connecting to Active Directory,
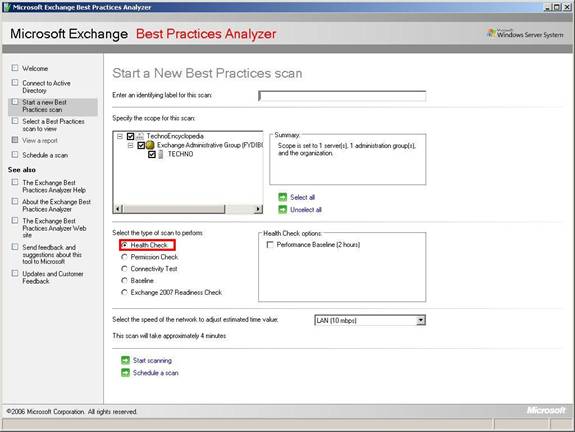
ExBPA presents options for the type of scan to execute, which are listed as Health Check, Permissions Check, Connectivity Test, Baseline, and Exchange 2007 Readiness Check. These are shown in Figure above. ExBPA runs these scans and returns a report of its findings relative to Exchange best practices. From a troubleshooting perspective, ExBPA does highlight problems and brings them to the
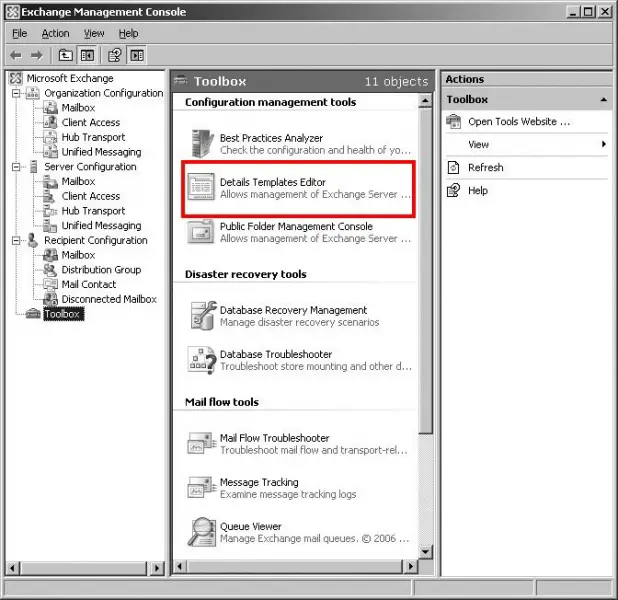
Details Templates Editor
Exchange uses detail (otherwise called display) templates to format and display directory information when Outlook users view details about objects in the GAL. You can customize the templates to add new fields or remove some of the data that
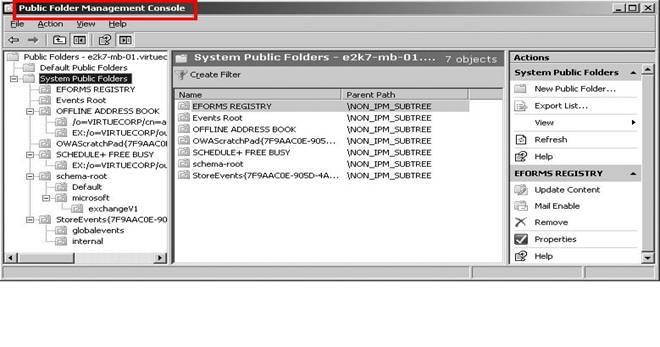
Public Folder Management Console
Exchange Server 2007 SP1 includes a graphical Public Folder Management
Console, as well as more features within EMC itself for better support of features such as
Public folder referrals.The public folder management console allows you to navigate through the
public folder hierarchy, divided into the default public folder tree (the folders that users see) and the system public folders, which are used for purposes such as storing the files required for legacy Outlook clients to access the Offline Address Book.
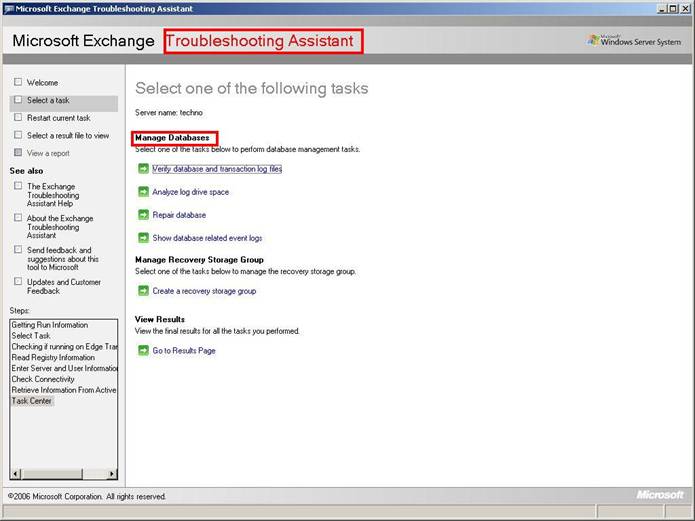
Exchange Troubleshooting Assistant in the Tools section of the EMC is several tools with “Troubleshooter” as part of their name. Launching any of these will start the Exchange Troubleshooting Assistant (ExTRA).The ExTRA essentially becomes another portal to the Troubleshooter tools. It is intended to host the tools used in reaction to issues rather than maintenance tools. The ExTRA tools can be run locally on the server in question, or remotely from another Exchange server or a server with
The Management Tools installed.
Database Troubleshooter
The tool is designed to locate problems that cause the following problems for Exchange databases:
Ø Databases will not mount.
Ø Log files are inconsistent.
Ø The transaction log file generation code has exceeded the range of available numbers to create new log files.
Ø Disk space is unavailable.
The database troubleshooter works by scanning the application event log for any entries that relate to the Exchange Store and then analyzing the results that it retrieves. You give the troubleshooter a time range to scan.
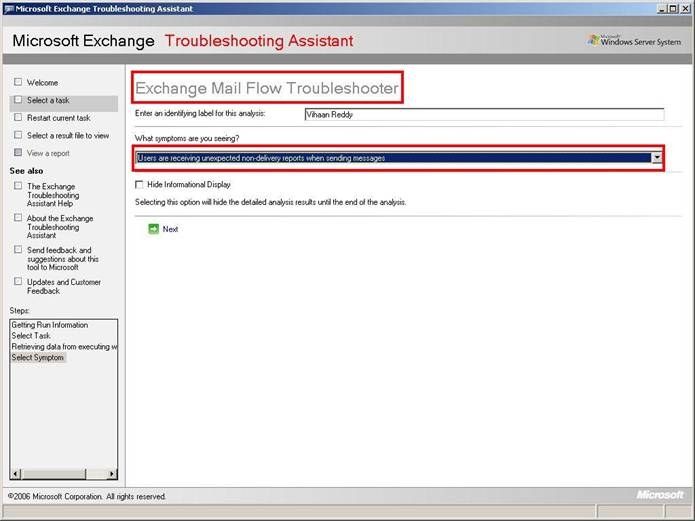
Mail Flow Troubleshooter
The Mail Flow Troubleshooter also offers the administrator a set of symptoms to troubleshoot against. The logical steps toward resolution vary with the symptom selected.
• Users are receiving unexpected nondelivery reports when sending messages
• Expected messages from senders are delayed or are not received by some recipients
• Messages destined to recipients are delayed or are not received by some recipients
• Messages are backing up in one or more queues on a server
• Messages sent by users are pending submission on their mailbox server
• Problems with Edge Server synchronization with Active Directory Mail Flow Troubleshooter gathers information from the Exchange server with WMI and from Active Directory and reports on the selected symptom with a link to the related page in technet.microsoft.com.
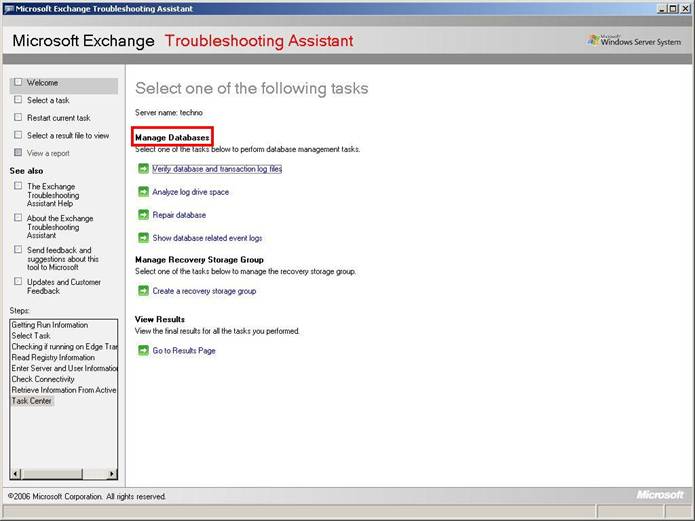
Database Recovery Management Tool (DRM)
The DRM tool is fairly complex to navigate. Table below defines the various DRM tasks that you can perform.
| DRM Task Description | Description |
| Analyze log drive space | Determines drive space issues for databases and log files |
| Repair database | Repairs corrupted databases |
| Show database related event
logs |
Generates a report on database errors in the Application Event log |
| Verify database and transaction log files
|
Determines the reason why databases fail. Also used to verify file availability for restore procedures. |
| Create a recover storage group | Creates a recovery storage group for restoring mailbox data |
| Merge or copy mailbox contents | The RSG task that restores mailbox content |
| Mount or dismount the databases in the recovery storage group | This RSG task is necessary as the RSG databases are not visible in the EMC. You can use this tool to mount and dismount the recovered databases as well |
| Remove the recovery storage group | This RSG task removes the existing recovery storage group after restores are complete. |
| Set up “Database can be over written by restore” flag | This is a mandatory step for production databases prior to a restore. Empty databases added to the RSG will automatically have this value set |
| Swap databases for “dial-tone” scenario | Used to swap the temporary database with the recovered database. The paths are changed, and the configuration information in AD is updated |
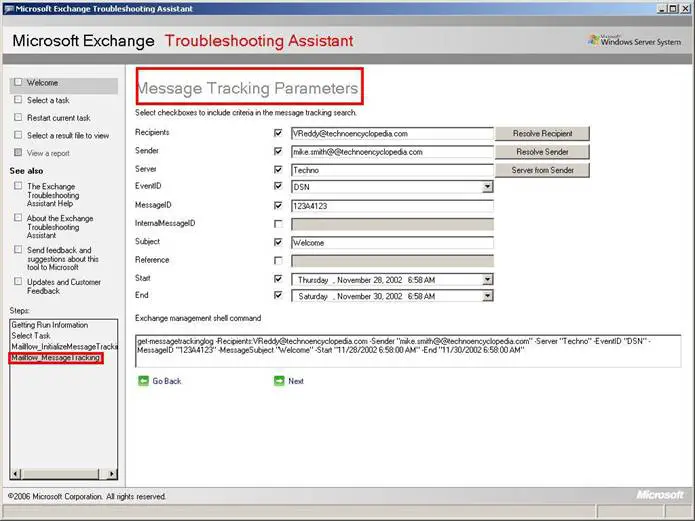
Message Tracking
Message Tracking tools to track the path of a message through the Exchange 2007 organization to the point where it goes to a legacy Exchange server or leaves the organization via an external gateway.In Exchange 2007, Message Tracking is configured using the EMS, but the interface is accessed through the EMC Tools section. The Message Tracking tool applies the criteria to its search and returns the matching content summary. You can select individual messages from those messages returned by the filtered query by selecting them and clicking Next at the bottom.
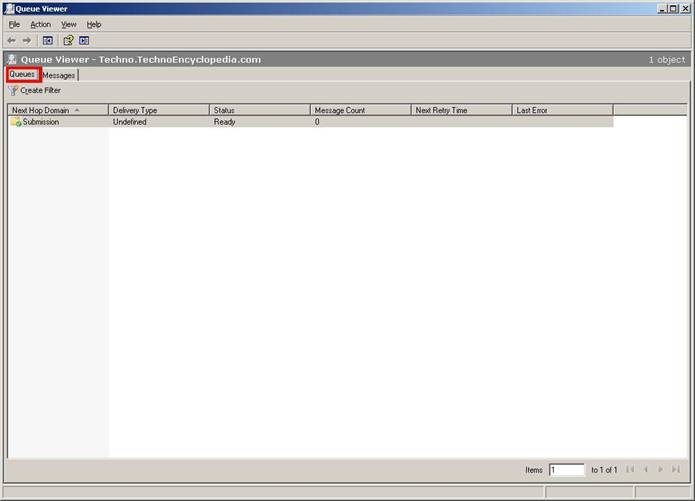
Queue Viewer
The Queue Viewer is accessed through the EMC and lists SMTP messages, inbound or Outbound, that has not completed their journey. These may be delayed deliveries because The destination server is offline, DNS resolution is failing, or disruptions have occurred between Hub Transport servers, as well as many other issues. The Queue Viewer will identify all messages specific to a domain and can show the status of each message in the queue. Queue contents are filterable where specific message types can be presented in the window based on dates, message IDs, addresses, and SCL values.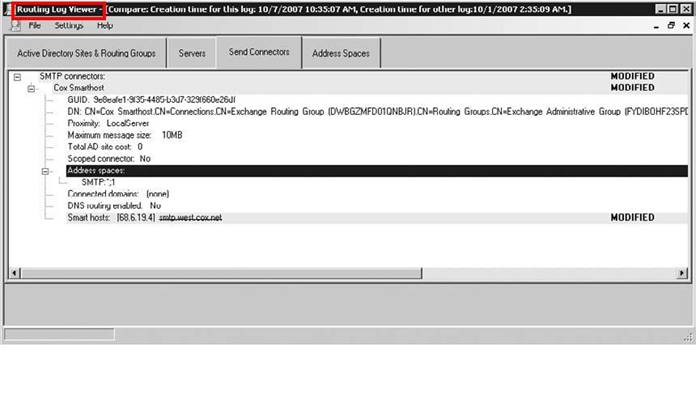
Routing Log Viewer
In the EMC Toolbox is a Routing Log Viewer that renders the .xml snapshots in a GUI. One of the features of this viewer is a log file comparison showing what changed in the routing. Figure above shows that the Send connector was changed from the Fully Qualified Domain Name of a smarthost to its IP address.
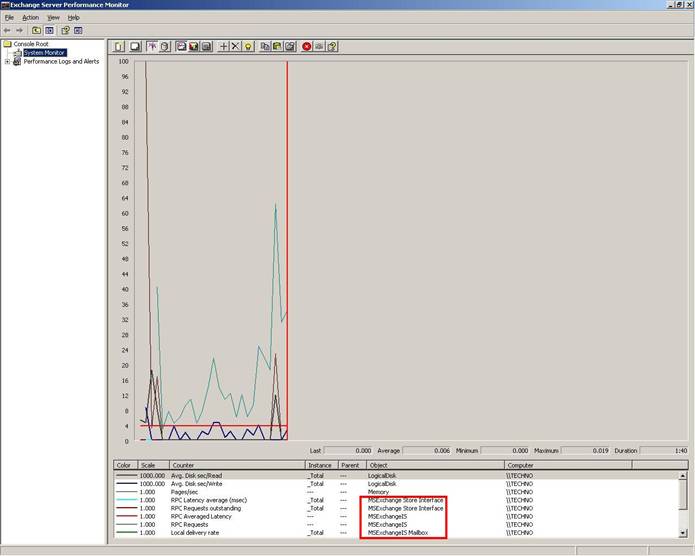
Performance Monitor
Just about everything that you need to monitor the health and performance of an Exchange server is included with the Performance Monitor. Anumber of Exchange-specific performance objects that can also be used to monitor numerous aspects of your Exchange organization are included in the performance monitor console. Although the standard Performance Monitor tool can be opened by typing perfmon.msc, a version of PerfMon is included with Exchange 2007 in the BIN directory called ExchPrf.msc. The figure above highlights the exchange counter used for monitoring
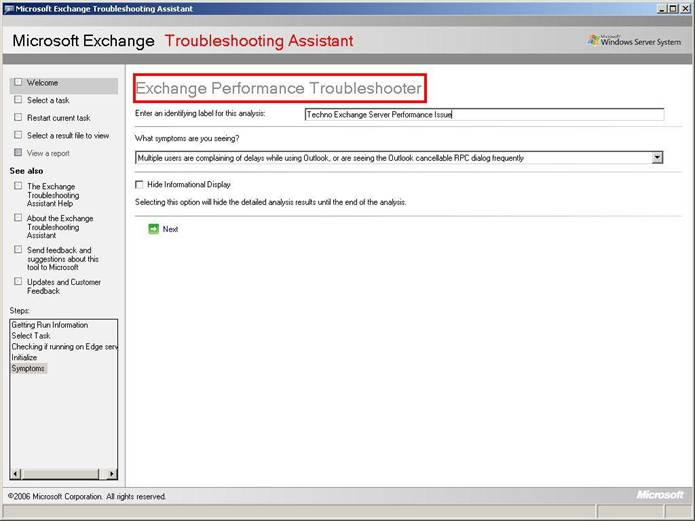
Exchange Performance Troubleshooter
The Exchange Performance Troubleshooter, shown above is another tool available in the Toolbox in the Microsoft Management Console. It is useful for diagnosing performance problems related to RPC connectivity. The Performance Troubleshooter collects data from different sources, analyzes the data, and then offers advice for fixing any problems it finds.


