
As developers, we all know debuggers. A debugger is a tool that you can use to run your code in a tightly controlled environment. It allows you to inspect and analyze the internal state of your code and find and fix bugs that may be hidden deep in your code. We use debugging tools daily; they are an essential part of programming. The IntelliJ IDEA debugger has many valuable and powerful advanced features to make debugging more accessible and efficient. These tips will help you find and fix errors faster. Let’s get started.
1. Fold Logs
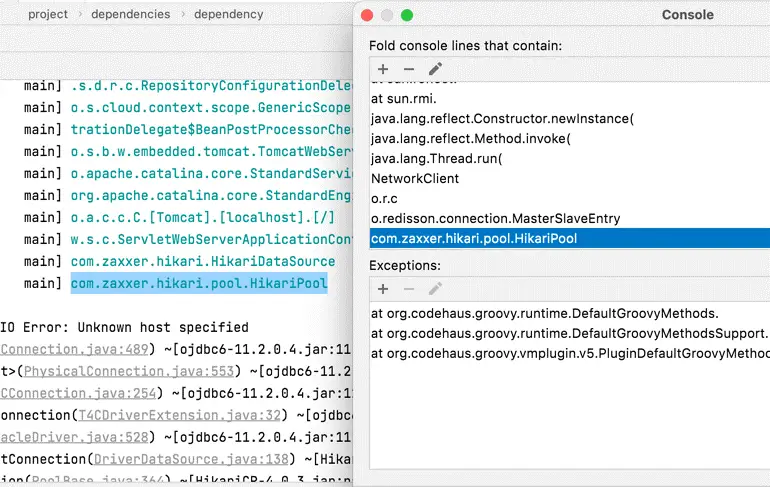
Running an application can produce a lot of console output. Most are unhelpful and come from third-party libraries. You can bend the console output lines from these libraries. This will help the user focus on the important information.
- Please Select the class name on the logline and right-click on it.
- Then select “Fold lines like this.”
That will open a window and add this layer to the list of layers to collapse. You can then change that class name to a package name to collapse all the classes in that package.
2. Use Exception Breakpoints
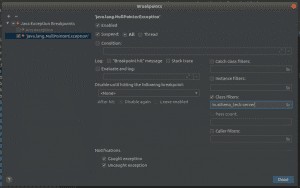
Breakpoints are places in the code that pause the program to allow debugging. They allow you to test the behavior of your code and its functions and try to identify errors. We recommend using exception breakpoints. This breakpoint will pause the program on an exception type and not in a predefined place. We highly recommend the IntelliJ Exception breakpoint because you can also filter out the class or package of exceptions that are part of it.
3. Pause, Resume Or Restart The Debugger
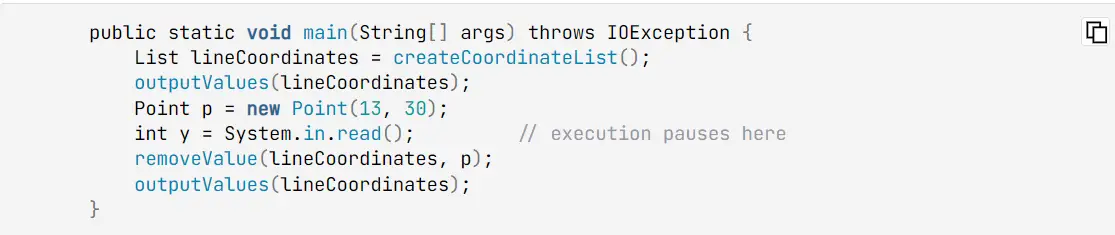
If your code seems unresponsive, you can pause the program to analyze where your code is stuck. Run your application in debug mode. If you don’t enter a value, your app seems to stop responding. In the debug window, click Suspend Program, and the editor window will show the class and method your application is executing—or stuck on.
4. Use Condition In Breakpoints
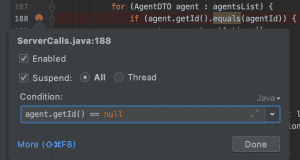
It is one of the most miniature tools in the debugger and probably one of the most effective. Using constraints to narrow the problem is much easier, saving time and effort in researching the issue. For example, in a loop, you can set a breakpoint that will stop at the actual error, saving you from having to manually go through the loops until you crash!
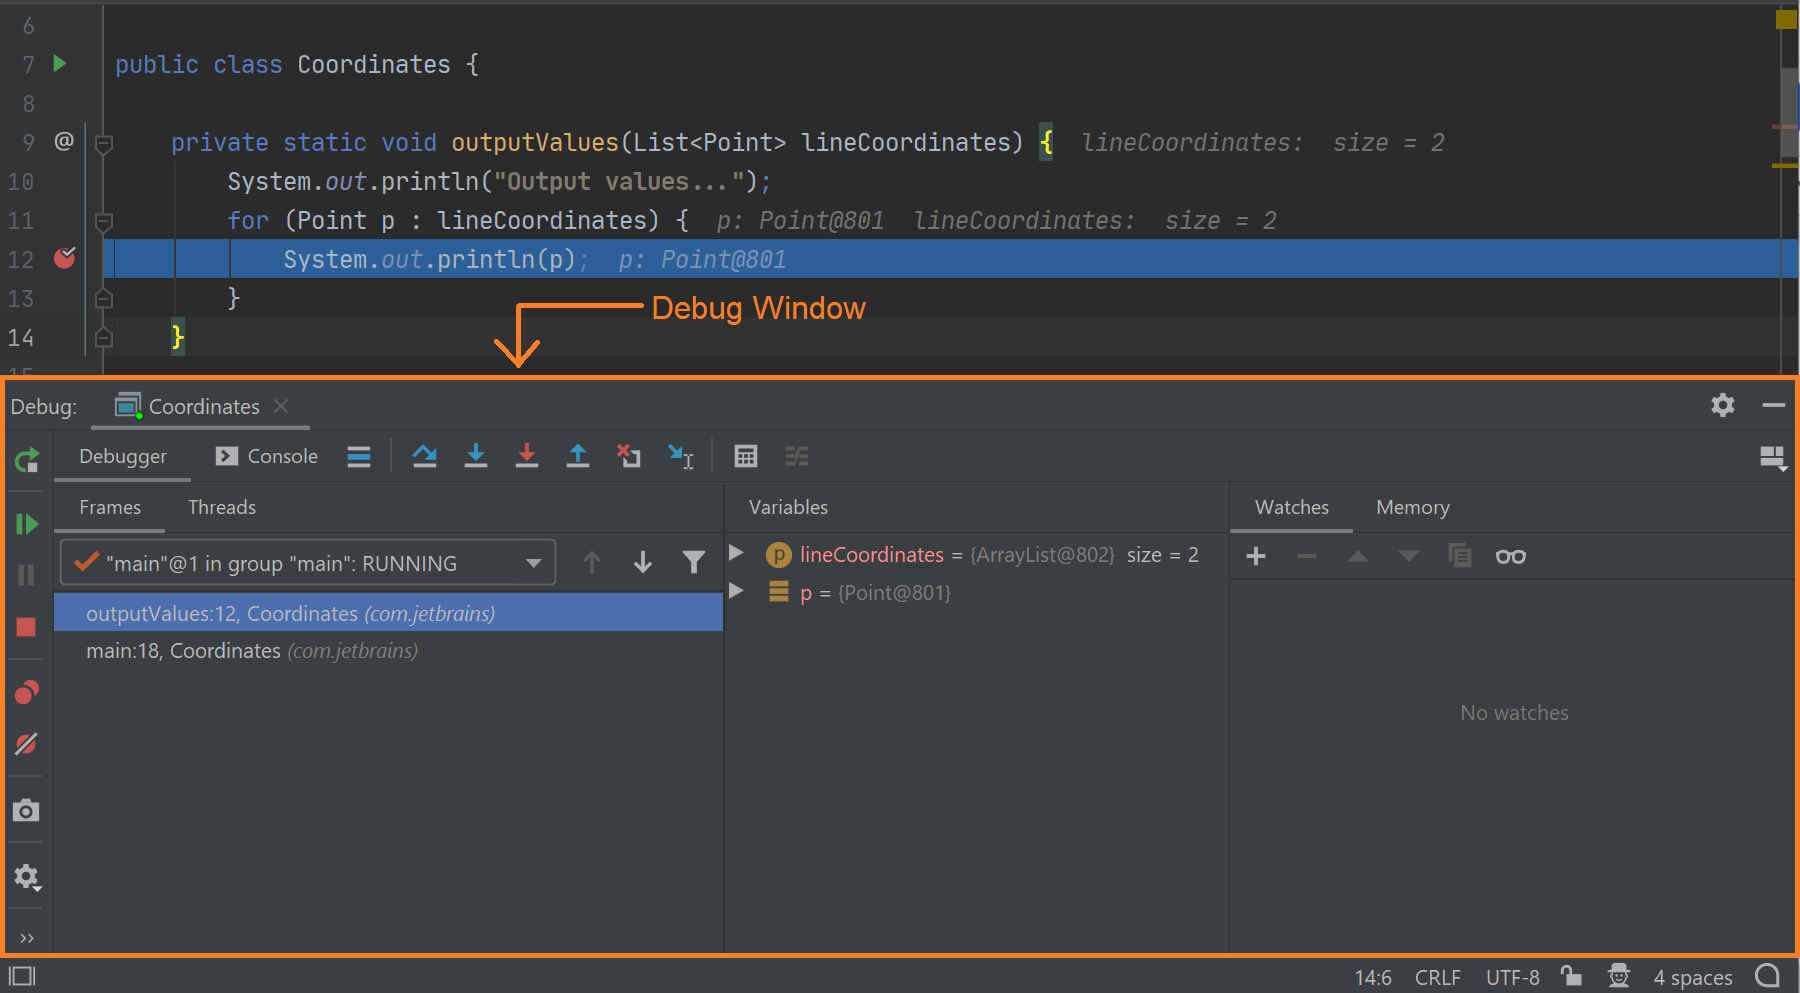
5. Debug Window
The debug window shows essential information when your application suspends execution on a breakpoint, such as frames, threads, console windows, step action icons, variable panes, and more. You can use the debug window not only to navigate through your code in debug mode but also use it to see all the breakpoints in your program, disable them, and make modifications. Include their actions. If you close the debug window by mistake, you can again open it with the keyboard shortcut Alt 5 (Win/Linux) or 5 (macOS).
6. Enable The “Internal Actions” Menu
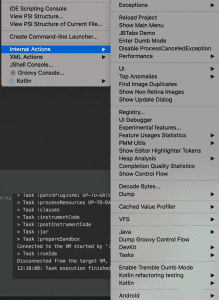
If you are writing a custom IntelliJ/IDEA plugin, enable internal actions (Tools -> Internal Actions) for easy debugging. This feature includes many handy options, like the component inspector and the UI debugger. It’s always handy to have a wide variety of tools at your disposal, giving you options you might never have thought of. To enable internal actions, select Help Edit Custom Properties and then type
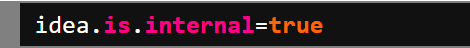
And save. After the reboot, you should see a new option in the Tools menu.
7. Show Git History For A Piece Of Code
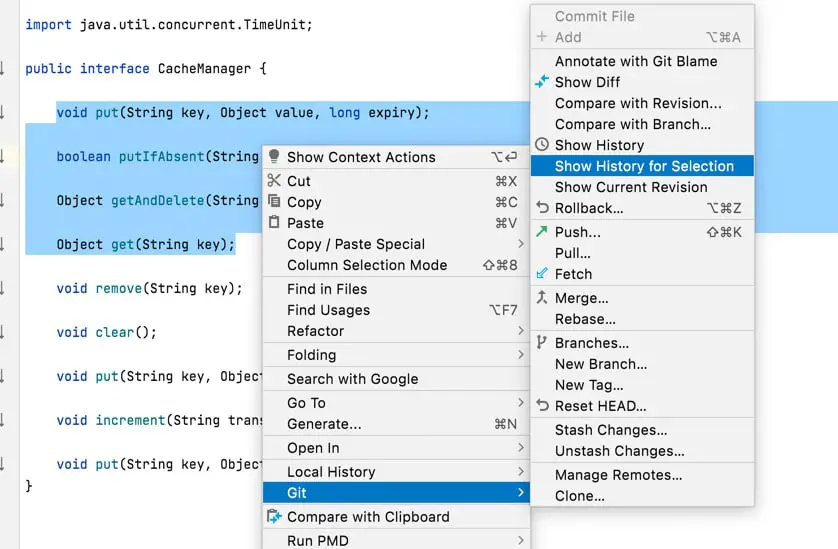
You see a code and don’t know what it does. To get an idea of the code, you need to understand why it was written and, or who wrote it. Learn by using Git history. Select snippets, right-click on the Git section, and select “Show history for selection.” These will list all old commits and code changes.
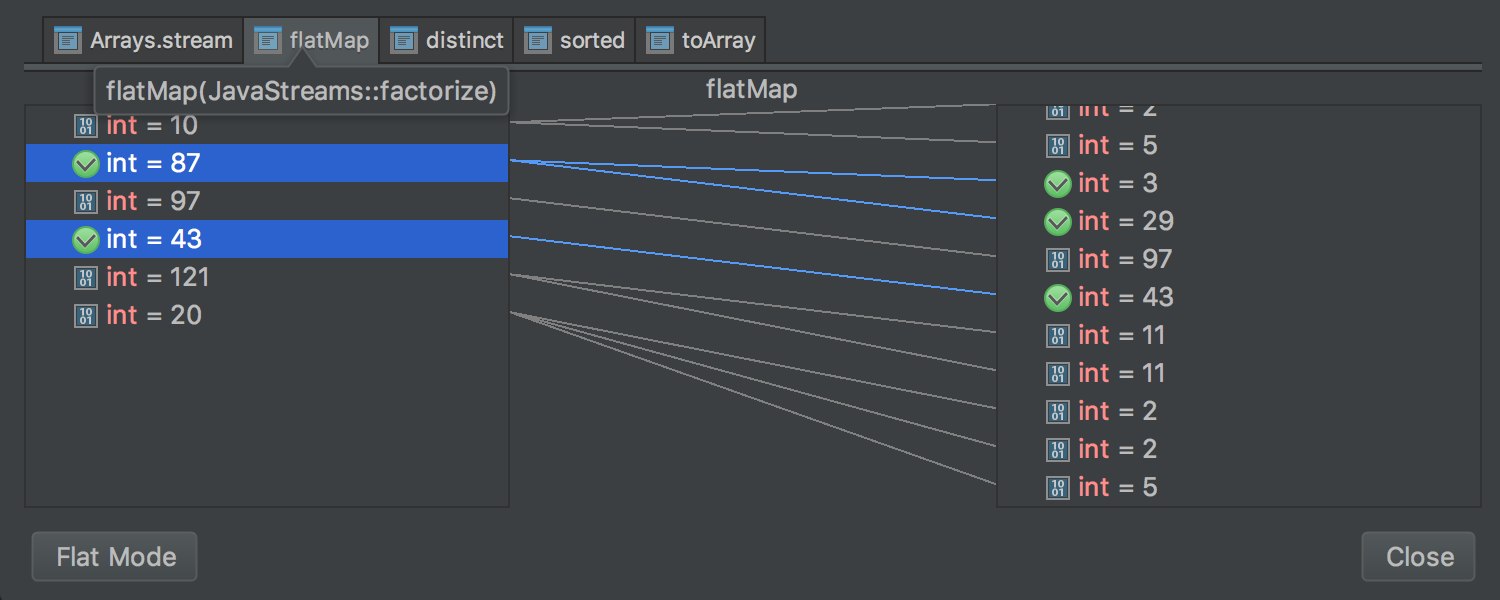
8. Use Stream Debugger
IntelliJ has a brand new tool, the stream debugger. You can use it to visually inspect the result of a stream operation. When you reach a breakpoint on a thread, tap the thread debugger icon. You will see the UI mapping of the value of the flow items for each step/function of the thread. As a result, each step is visually displayed, and you can see the activities in the process and detect problems.
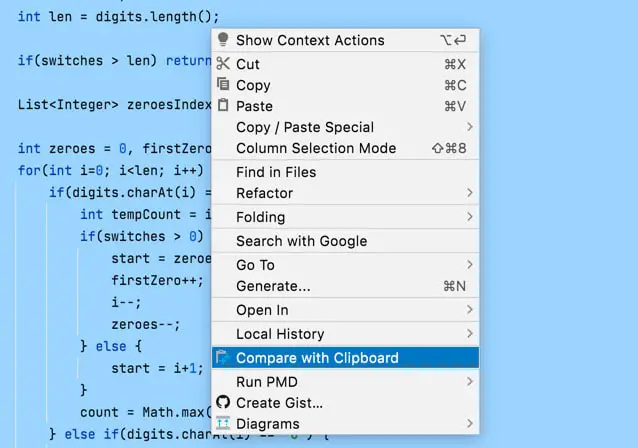
9. Compare Files With The Clipboard
You can compare the file’s content with the contents of the clipboard. That is useful for comparing files that are not part of version control. That can be used quickly to compare and merge two files. A typical use case is comparing configuration files.
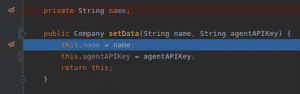
10. Field Watchpoint
Field Watchpoint is a breakpoint that pauses the program when the specified field is accessed or modified. That can be very helpful when you investigate and find an area that has a wrong value and you don’t know why. Looking at this field can help find the source of the error. To set this breakpoint, add it to the line of the desired area. The program will pause when, for example, the field is changed.


")


