Regression is a supervised learning method in machine learning that helps to determine the relationship between data and label points. The future values in ML are derived using regression algorithms. Regression in ML offers a wide range of applications.
Regression analysis is performed to identify the relationship between a dependent and one or more independent variables. It can forecast predictions, time series modeling, and determining the “causal effect relationship” between the variables.
Regression analysis is an ideal tool for data analysis. It provides a clear picture of the relationship between the two variables and the impact of multiple independent variables on the dependent variable.
ML utilizes regression algorithms to forecast continuous variables such as housing prices, exam scores, medical outcomes, etc. Python offers an array of libraries to implement regression algorithms successfully. Let us understand the top 10 regression techniques widely used in Python and Machine Learning.
1. Linear Regression
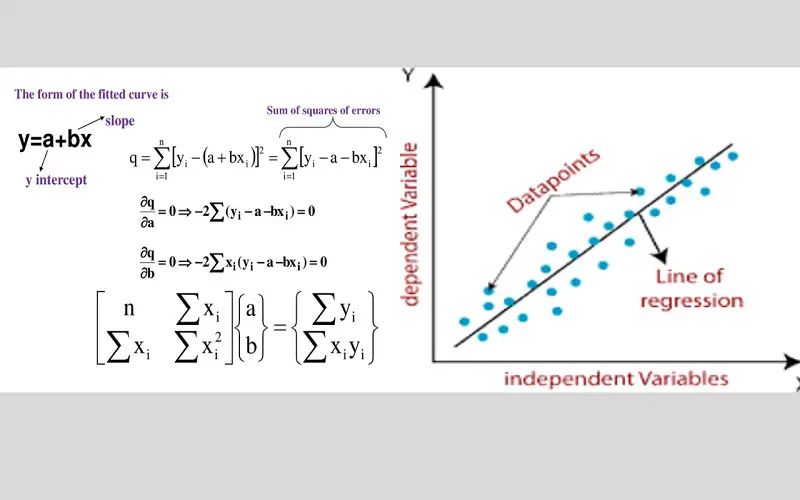
Linear regression is the most commonly used method in regression analysis. The statistical model determines the relationship between a dependent and an independent variable. It focuses on creating a relationship between the dependent variable and multiple independent variables with the help of a straight line known as the regression line.
The relationship is represented by formula:
Y=a+b*X+e
“a” stands for intercept
“b” is the slope of the line
“e” is the error term
2. Logistic Regression
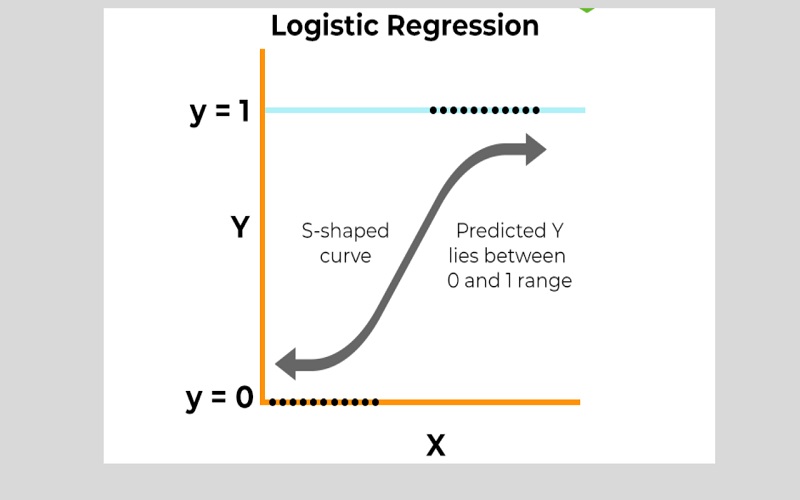
Logistic regression identifies the probability of Success and Failure in an event. The method delivers a binary outcome limited to only two possible outcomes: 0/1, yes/no, or true/false.
The method is ideal for solving classification problems.
The equation that best represents the method is:
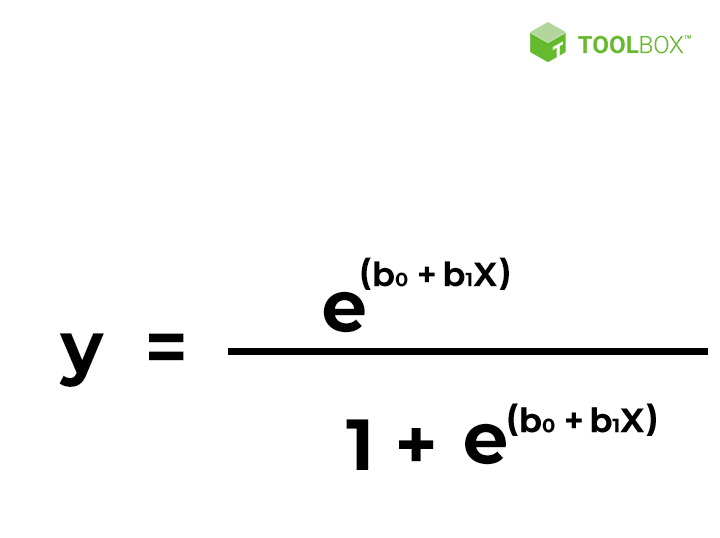
“x” stands for the input value
“y” stands for predicted output
“b0” stands for intercept term
“b1” stands for coefficient for input
3. Ridge Regression
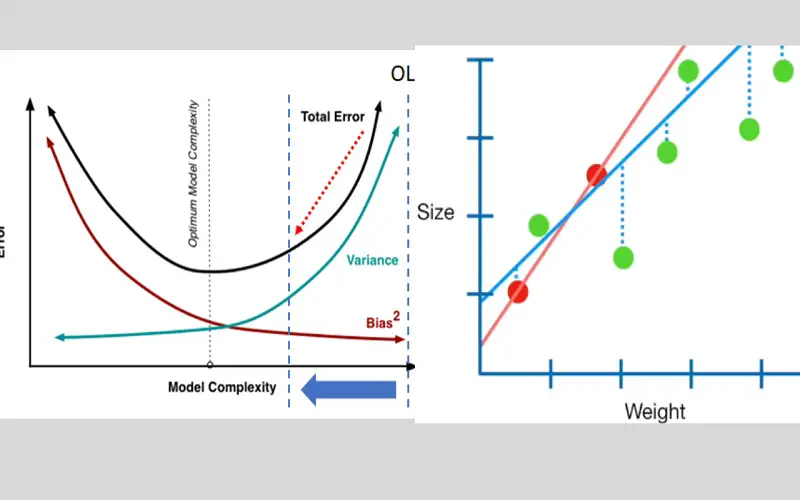
Ridge regression is a popular linear regression algorithm used in machine learning. It helps to minimize the loss incurred in linear regression. The method is mainly used in cases where the independent variables are highly correlated. Ridge regression reduces standard error by adding a degree of bias to the regression estimates. It helps to reduce the complexity of the ML model. The equation for Ridge regression is:
y = Xβ + ϵ
“ y’ stands for a dependent data variable
“ X” stands for matrix of regressors
“ β” stands for the regression coefficient
“ ϵ” stands for vector of errors
4. Decision Tree Regression
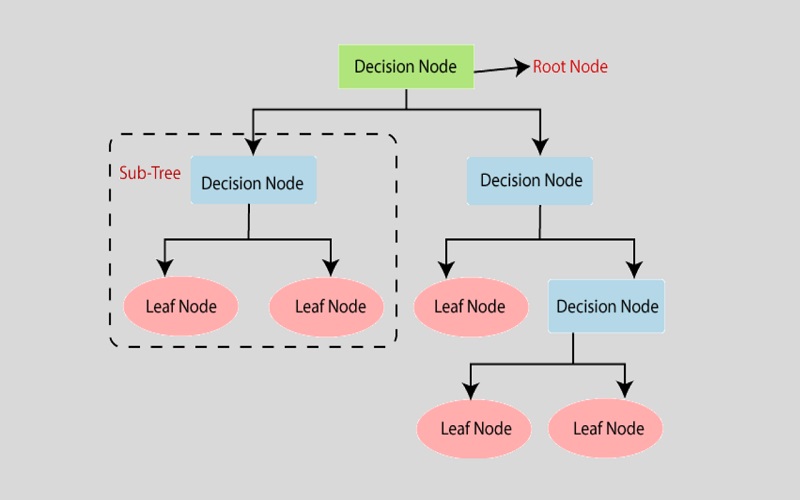
Decision tree regression is a non-linear method that uses decision trees to predict the relationship between a dependent and multiple independent variables. The model is used in classification and regression problems in Python. The subsets of the dataset are leveraged to plot the data points that address the problem accurately. The method splits the data set that results in creating a decision tree and leaf nodes.
5. KNN Model
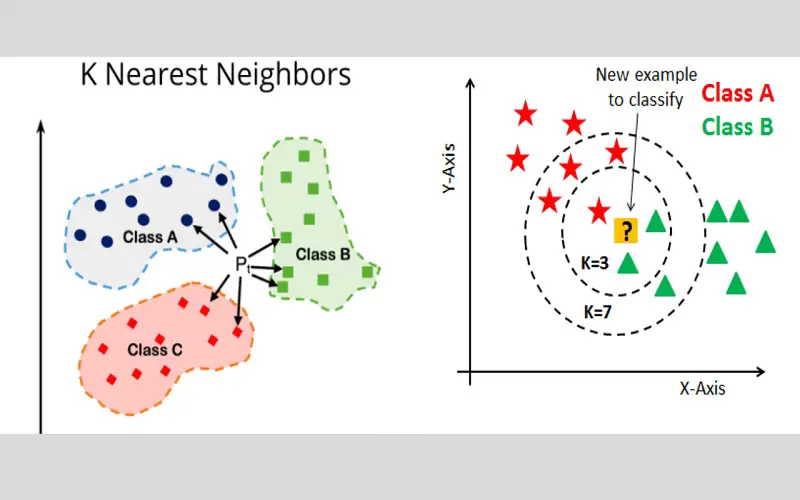
KNN model is a popular non-linear regression technique known for its straightforward implementation approach. The model assumes that both existing and new data points are similar. By incorporating the latest data point the model creates a relatable category by drawing comparisons to the existing ones. The average value of K’s nearest neighbor is taken as input. KNN stands for K’s closest neighbor. The neighbor with the most significant impact on the average value is allowed with particular weights.
6. Stepwise Regression
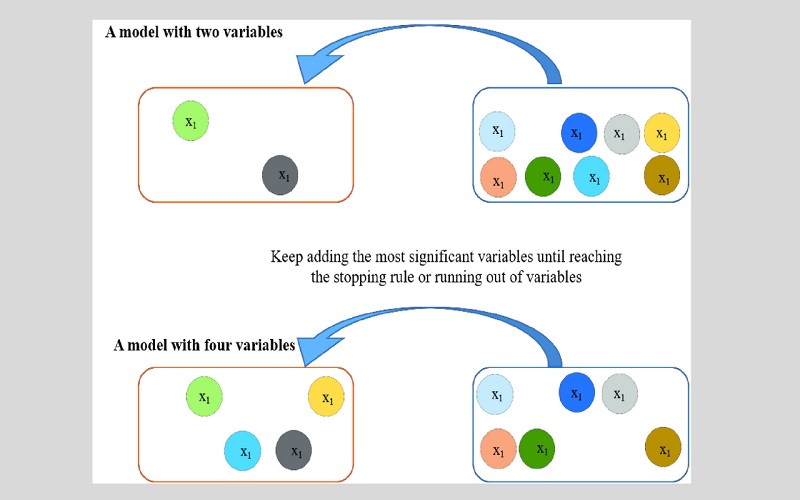
Stepwise regression is ideal for those regression models that deal with multiple independent variables. Independent variables are traced through an automatic process without encouraging any human intervention. A standard stepwise regression adds and removes predictors in each step. Forward selection begins with the most important predictor in the model. Backward elimination focuses on all predictors in the model and the least significant variable is eliminated in each step.
7. Lasso Regression
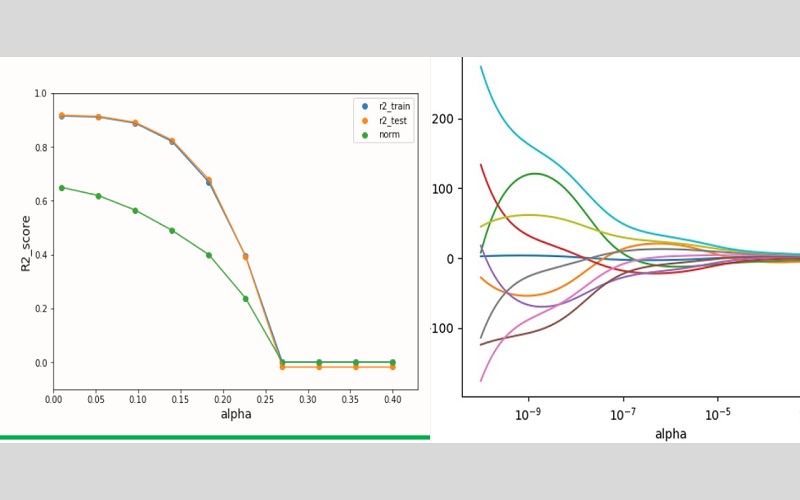
Lasso( the abbreviation for Least Absolute Shrinkage and Selection Operator) is a linear model that can efficiently reduce variability and improve the accuracy of linear regression models. It consists of L1-trained linear models. Lasso utilizes absolute values in its penalty function, penalizing the total sum of estimates. It almost shrinks coefficients to zero. When a set of predictors displays a high level of correlation, the Lasso selects only one of them and diminishes the others to zero.
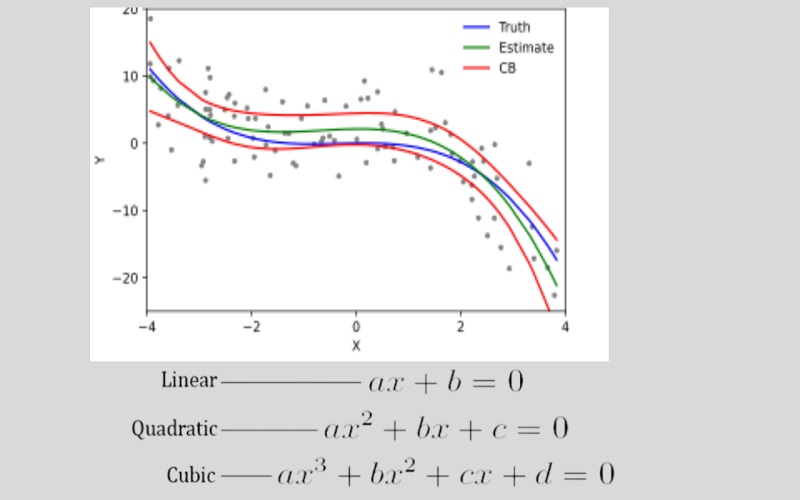
8. Polynomial Regression
Polynomial regression uses linear models trained on non-linear functions of data. The model ensures the high performance of linear methods while enabling the model to accommodate a broader range of data. In Polynomial regression, the line is not straight, it is slightly curved to fit into the data points. It is a powerful tool for predicting the complex relationships between economic factors like income, education, and employment. The equation that best represents the model is:
y=a+b*x^2
9. Random Forest
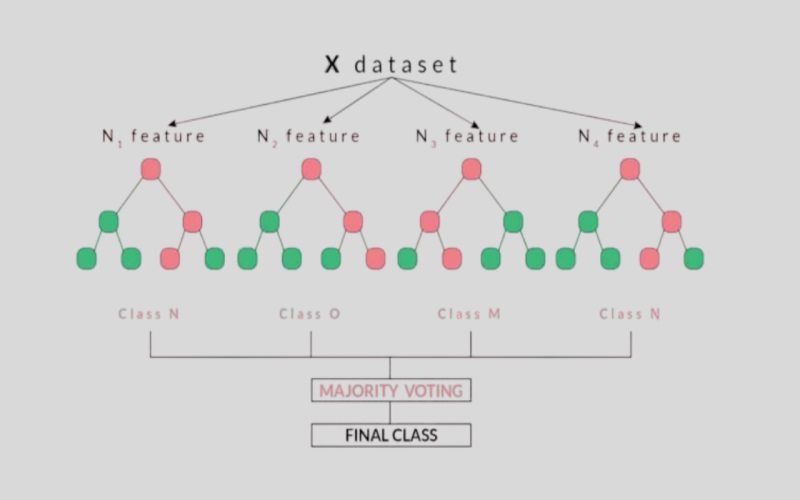
Random Forest is another popular non-linear regression technique, utilizing multiple decision trees to predict the output. A decision tree is created by selecting random data points from the given data set. Numerous decision trees are developed that can interpret the value of new data points. Random Forest can generate numerous output values. It derives the final output by calculating the average of all predicted values for a new data point.
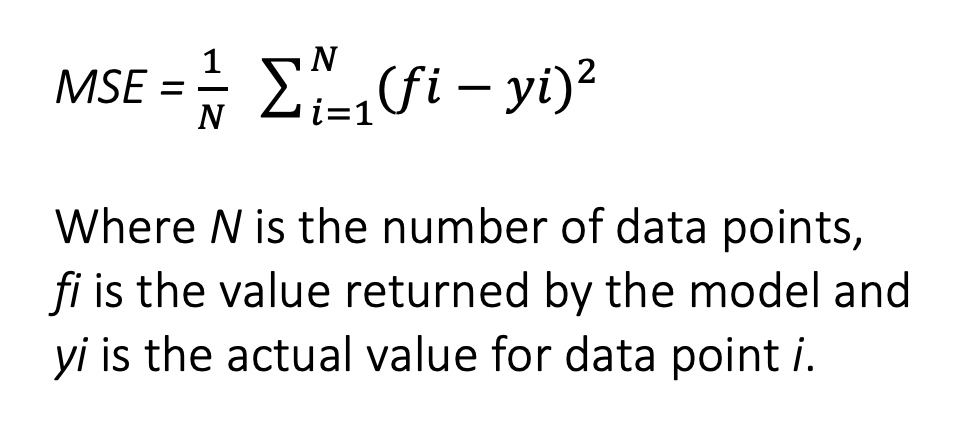
“N” stands for the number of data points
“fi” stands for the value returned by the model
“yi” stands for the actual value of the data point
10. Support Vector Regression
Support Vector Regression is a supervised learning technique that identifies hyperplanes to segregate data points into two distinct classes. The method focuses on minimizing classification errors. In SVR, the hyperplane segregates the data points from the prediction error and reduces the deviation margin between the predicted value and the actual value of the dependent variable. The model utilizes the “Kernel” function to handle non-linear data.
The formula for SVR is:
Linear SVR-

Non-Linear SVR-

