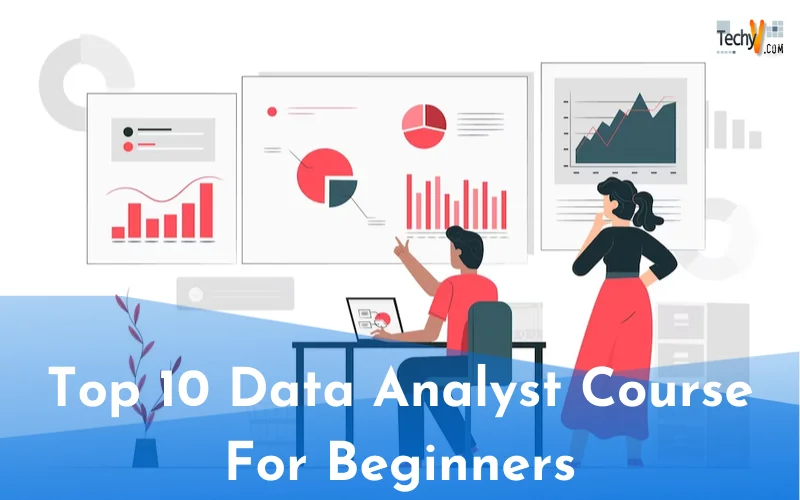
Data analytics refers to analyzing large and complex data sets to get insights and identify patterns. It may involve the use of mathematical and statistical techniques, algorithms, and machine learning techniques to analyze the data and extract the required information. It helps to get insights into useful information that can help organizations to make essential decisions. Data analytics is a valuable tool for any organization to make decisions which ultimately helps in the growth of the company and gives an edge in the market. For beginners who want to learn data analytics, here is a list of courses every beginner should consider to ace as a data analyst.
1. Complete Microsoft Power BI Bootcamp (Udemy)
Power BI is used as a data visualization tool created by Microsoft. It is a powerful business intelligence tool that is used for data analytics. It helps users to analyze and visualize large amounts of data. Power BI helps in creating interactive reports that help in growing business. It is compatible with various other data analytic tools such as Excel, cloud services, and many more.
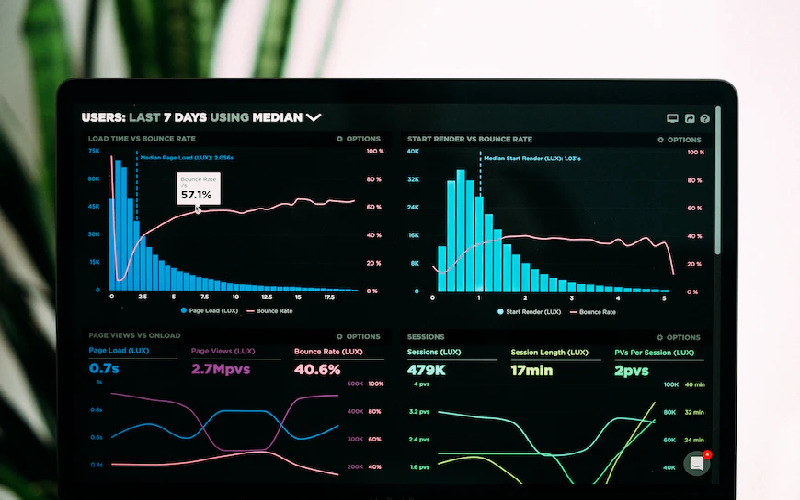
2. The Complete SQL Bootcamp (Udemy)
SQL Bootcamp is a training program that helps in getting an insight into SQL, which is a programming language used for managing and updating the data which is stored in the database. This Bootcamp aims to provide users with the knowledge needed to use SQL effectively which involves creating, editing, and managing databases.
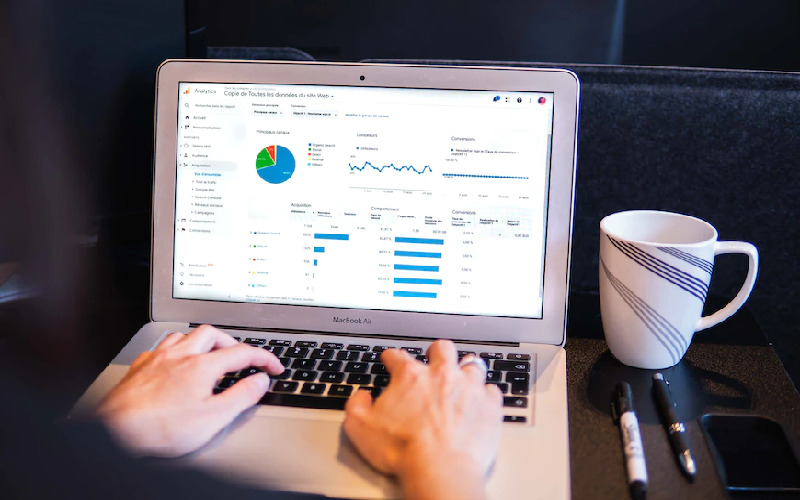
3. Excel From Beginner To Advanced (Udemy)
This Excel course is designed for beginners to get an insight into Excel. Excel is designed to work with various types of data, it offers a wide range of formatting options to users to create visualized and organized spreadsheets. Excel is the popular choice of working professionals for constantly updating, creating, and managing spreadsheets.
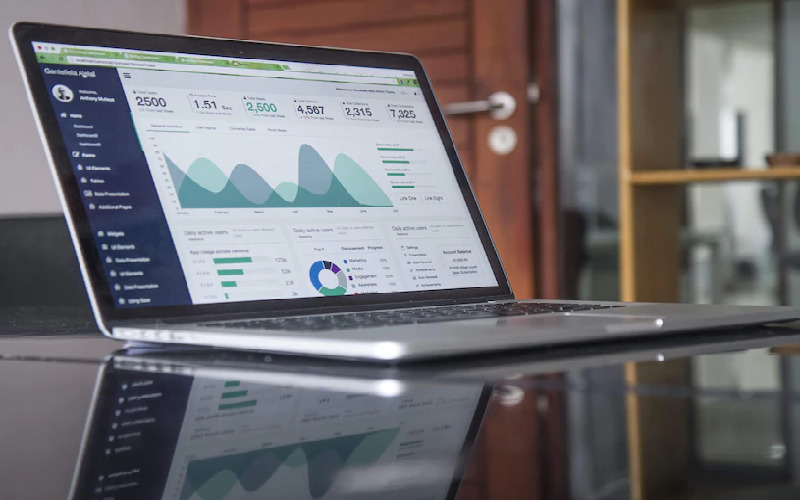
4. Hands-on Tableau Training For Data Science (Udemy)
Tableau is a data visualization tool used for visualizing and analyzing data interactivity. It allows users to connect, visualize, and share data to get insights easily. Tableau automatically updates data by refreshing data sources at regular intervals. Hands-on tableau training provides insight into the working of this data visualization tool for beginners.

5. Python For Data Analysis 2023 Full Bootcamp (Geeksforgeeks)
Python for Data Analysis Bootcamp is a short, intensive training program to get an insight into Python programming and data analytics. It offers real-world examples and data analytics projects that aim to provide real-world learning experiences in data analytics using techniques such as data cleaning, data manipulation, and data visualization which makes the learner a great data analyst.

6. Machine Learning And Deep Learning (Udemy)
When we deal with large volumes of data, it becomes essential to use proper tools for analyzing the data. In such cases, we can use machine learning for analyzing, updating, and for the maintenance of large volumes of data. It can be used efficiently with software like Python and R programming languages.

7. R Programming Complete Diploma 2023 (Udemy)
While performing data analysis, it is essential to learn about Tableau; It is one of the most popular data visualization tools used for analyzing data. Not only this, it helps the users to connect databases with various other machine learning tools such as APIs and Excel. Using this software, it becomes easy to analyze the data and perform the required job.

8. 2023 Data Analysis And Visualization In Python Masterclass (Udemy)
Python is used for data analysis and visualization, it helps in cleaning and analyzing data into a format that is easier to work with and makes statistical data out of it. Using different techniques, one can better understand about data analyst role. It provides deep knowledge about charts, graphs, and other tools for data analysis.

9. Tableau, Excel, And Looker Studio (Edyoda)
When we talk about data analysis, Tableau is one of the most popular data visualization tools used for analyzing data and for statistical representation of data. Not only this, it helps user to connect software with various other dalta visualization tools such as Excel, databases, and APIs. It makes our work easier and this course will help you to gain deep knowledge about data analytics.

10. Forecasting Models With Excel (Udemy)
Forecasting is one of the most essential tools for doing data analysis. We can perform two types of forecasting in Excel: time series and regression analysis. For the forecasting model, one must first gather the required data to perform appropriate analysis. It is available on Udmey and gives in-depth knowledge about Excel and its tools.


