Data visualization is an essential technique used to visualize data and information in an easy-to-understand manner with the help of maps, graphs, charts, visual tools, etc. It helps the data professionals to teach or present the data and information using pictorial representations. It also identifies the trend and outliers. Let’s understand it thoroughly, so whenever we think about the country-wise Human population of the world, automatically a graph or pie chart is drawn in front of our eyes, ‘What is it?’ It is the visualization of the data and information created by us to understand it in a better way. It is used by professionals during discussions and presentations for extra clarity.
It is mainly the practice of understanding and communicating complex data and information in an easily presented manner by using visual tools of different kinds. Though data and information visualization is an IT-based term, it is useful in almost every sector like, healthcare, finance, marketing, sports, and many more.
Now let us go deep into the topic and learn about ten uses of Data and Information Visualization in brief:
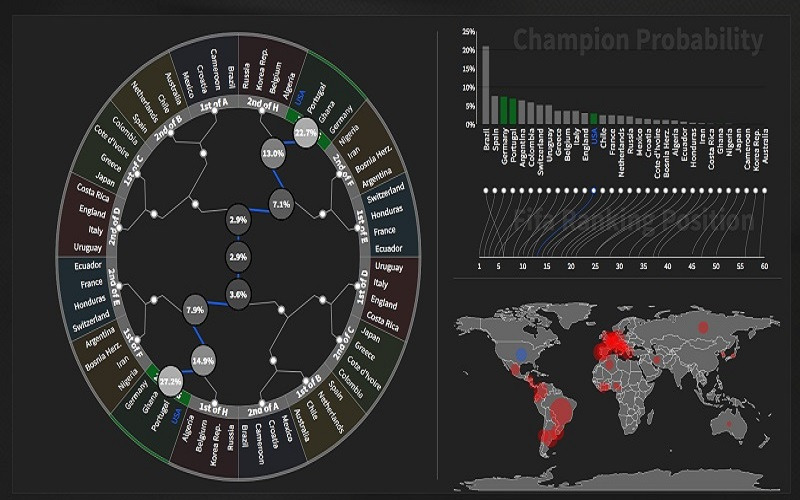
1. Data Visualization At The FIFA World Cup
Data visualization at the FIFA world cup can be used to analyze the country-wise probability of winning the world cup according to the data and information provided and then collectively visualizing them in different ways such as pie charts, graphs, maps, etc. so that it can be easily accessible. It is mainly used by sports analytics for prediction. Have a look at the team that you support.
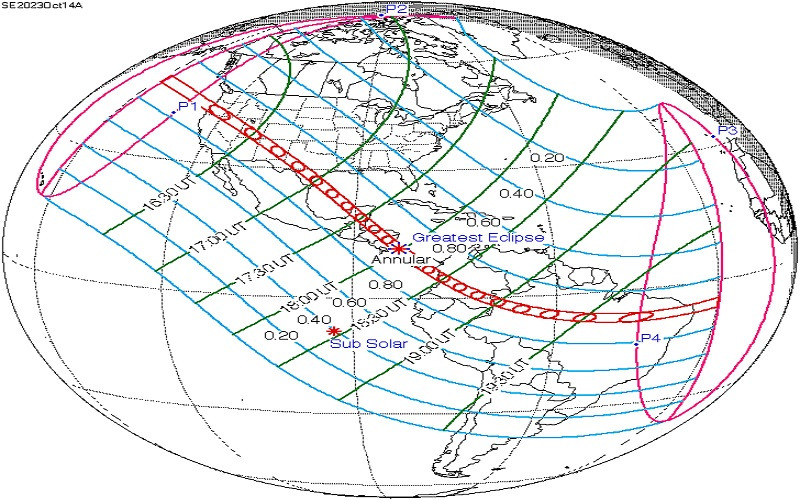
2. Upcoming Solar/lunar Eclipse All Across The World
Experiencing the total solar/lunar eclipse worldwide can be visualized by marking its path and location on the interactive globe with the help of data and information provided by NASA missions. With the help of this, we can know the number of eclipses we will experience during our lifetime and its impact on the astrological studies. So, when is the next time you are going to share a solar or lunar eclipse?
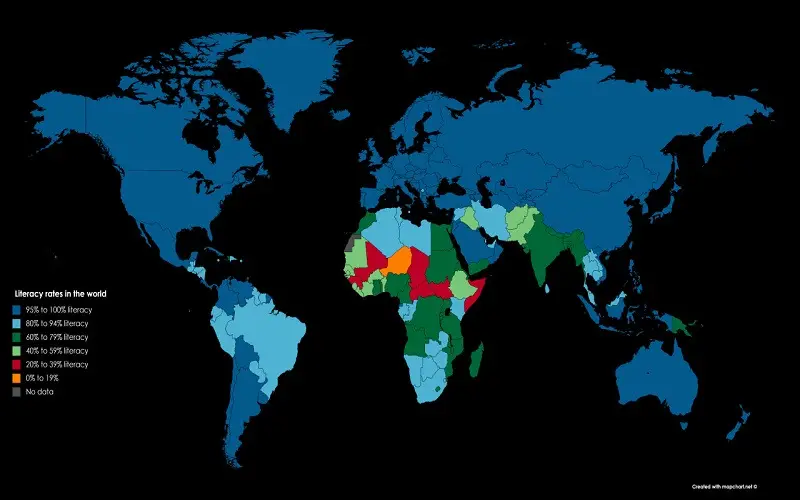
3. Country-wise Literacy Rate Of The Population
Visualization technique gives a very clear-cut idea about any data worldwide, like literacy rate, population density, morality or mortality rate, etc., with the help of map-based representation. It highlights the different geographical area in the map by marking the boundaries of different countries and then list the information accordingly. Based on the picture below, find out the literacy rate of your country.
4. Analysis Of The Stock Market Or Trading Industry
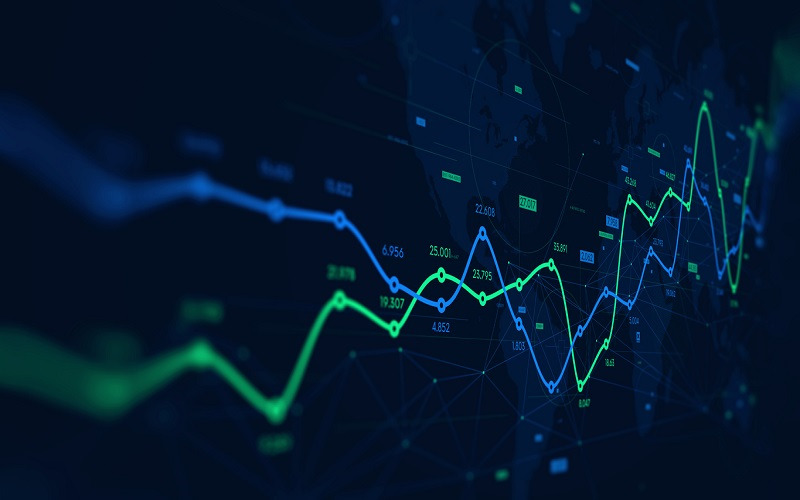
The fastest-growing trade industry governed by the stock market needs regular analysis and observation; this data and information visualization plays a vital role in this field. It helps keep a record of all the ups and downs of the stock, where you would have been planning to invest or already invested. So, give it a check, where your investment lies with the help of graphs formed.
5. The Upcoming Weather Forecast Of Your City
Data and information visualization help predict the weather forecast of upcoming days around the globe. By keeping a record of the precipitation rate and the distance at which, the wind travels help in upcoming weather prediction. Merging all these data in an easy-to-understand way so that we can monitor the weather changes and take preventive measures against upcoming cyclones, floods, drought etc. So, by which time is monsoon is going to knock the door of your city?

6. Data Provided By Health Policy Agencies
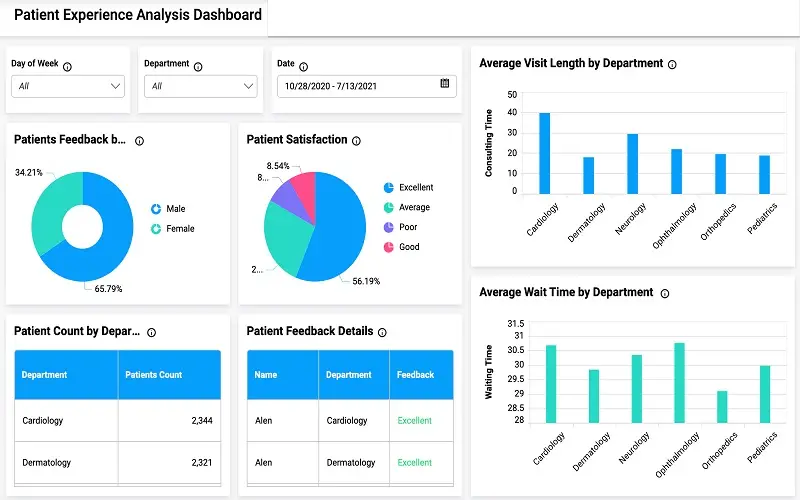
Data and information visualization have the potential to enhance the decision-making capability of people who are interested in taking health policy by professionals. The data shown to them are simple and efficient. Along with that, it also helps in spreading awareness about diseases and protects the society. You must have heard that, “Prevention is better than cure.”
7. Sales And Target Analysis Of The Organization
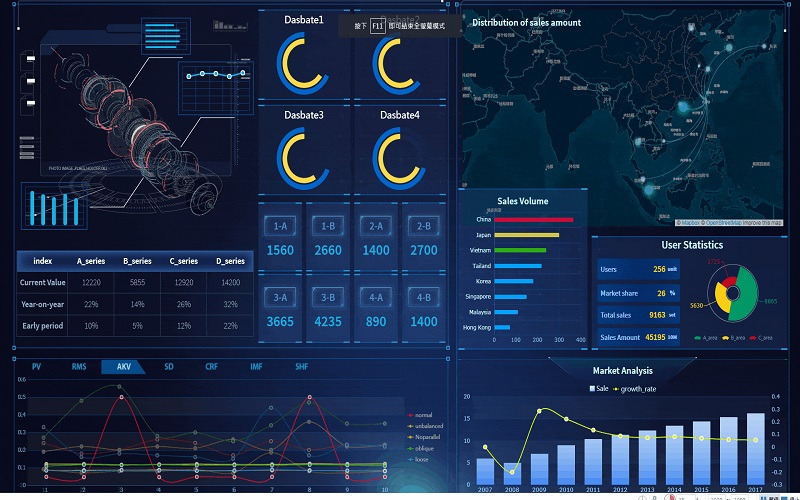
We all know that establishing any company or an organization requires analyzing a lot of data and information, and to keep a record of all those things with simplicity, we need data visualization. It makes the work more accessible with the help of pie charts, graphs, visual tools, etc., to keep the record of several employees in a summarised way. It also gives the statistical analysis of the user and the target achieved for future reference.
8. Understanding Different Kinds Of Market Research Data
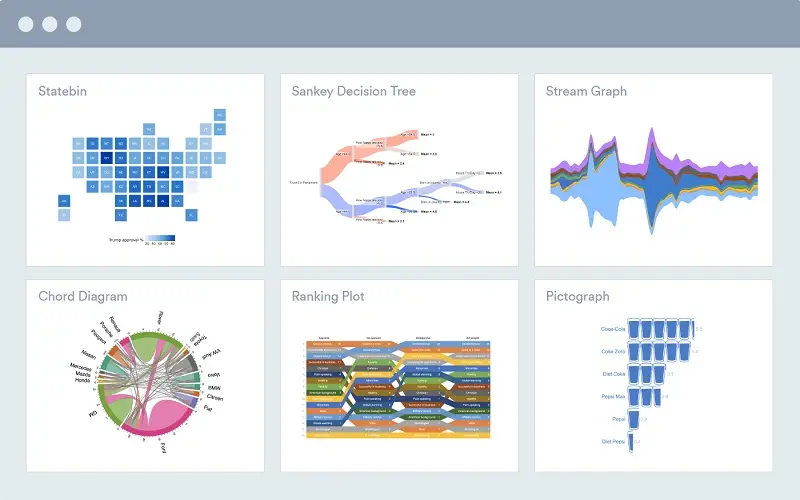
This world has a huge market with tons of data and information; it is challenging to visualize them all separately. So, we use different way for data visualization, such as decision trees, pictographs, chord diagrams, etc., to understand them all more efficiently, and interestingly, it works; for example, do you all remember the family tree we used to make in our childhood? It is fun. Isn’t it?
9. Comparative Study And Presentation Purposes
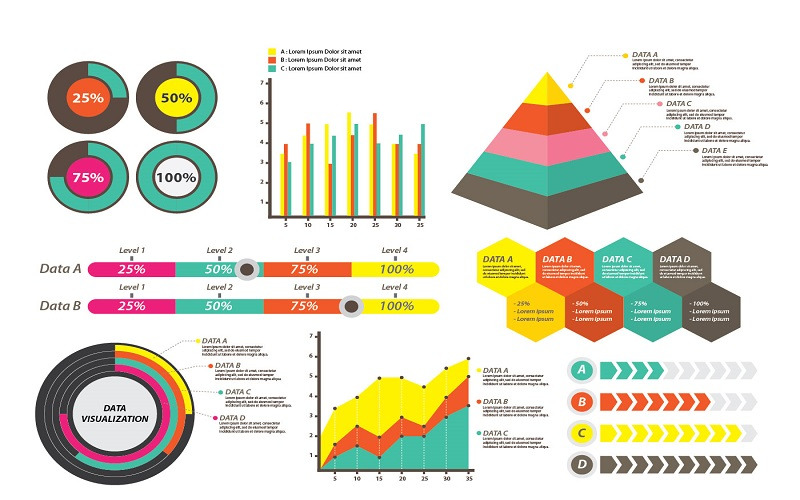
In every field, it is necessary to perform a comparative study and then present it in front of a large audience to convince them. It requires pictorial representation using graphs, pie charts, etc., that in simple words, we term as data and information visualization used to convey our study in a story-telling manner to leave more significant impact on the audience or the panelist. So, when was the last time you stood up for a presentation?
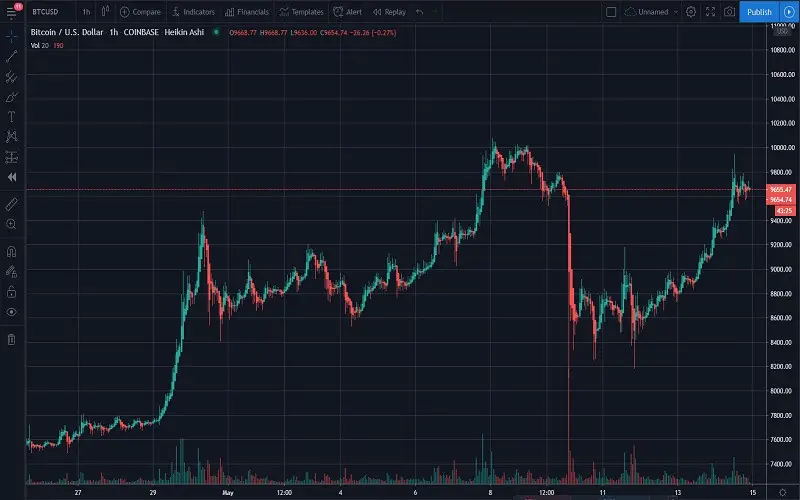
10. Cryptocurrency Chart And Records
One of the most burning topics of this generation is related to cryptocurrency, which focuses on different investment currencies like bitcoin, Litecoin etc. Data and information visualization help to give a comparative chart of these currencies for broad or comprehensive references. It allows the investor to gain more clarity and take the necessary steps for further investment. So, in what way this data visualization helped you?
