Achieving faster, more reliable software delivery relies on continuous improvement across complex systems. However, moving beyond gut instincts requires quantifying development and operational efficiencies. By tracking key DevOps metrics over time, teams establish numerical baselines benefiting objective evaluations. Rather than seeming esoteric, I present an approachable overview below highlighting ten essential metrics warranting monitoring. I focus more on discussing practical implications and targets instead of calculations. For example, linking lower Change Failure Rates towards encouraged innovation and controlled experimentation. Reports then contextualize daily work as contributing insights toward long-term objectives. Still, formulas receive mention given the mathematically-inclined audience. Approach these foundations as starting points for customizations meeting your unique stack and workflows.
1. Lead Time For Changes
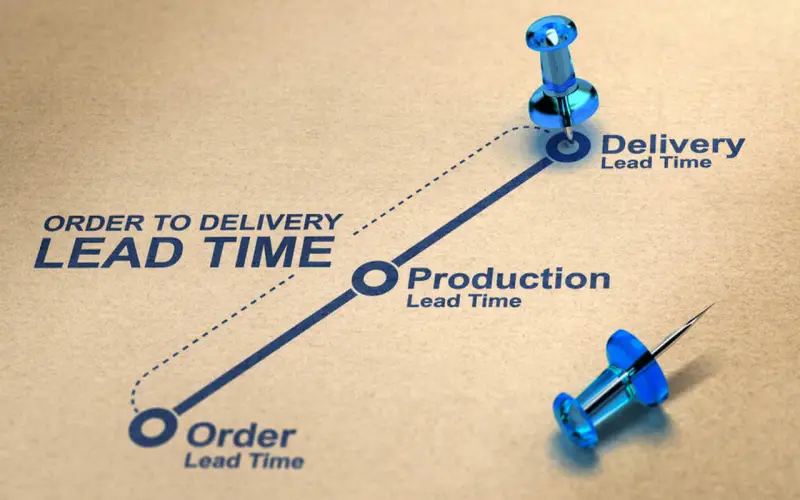
Calculating total time from development starting on code changes until availability in production, Lead Time benchmarks development velocities tracking bottlenecks like elongated testing phases. Compare feature enhancement estimates against Lead Time realities informing future planning. Optimizing deployment pipeline stages then accelerates iterative improvement best leveraging developer productivity. However, beware of overvaluing speed alone since technical debt and architectural shortcuts inevitably degrade codebases later. Still, expect a middle ground balancing velocity and quality exists warranting further analysis.
2. Deployment Frequency
Similar to Lead Time, increased Deployment Frequencies signal mature continuous integration and delivery patterns preventing work silos. Establish baseline release cadences such as daily or weekly expecting 2x improvements annually. Higher frequencies encourage smaller, incremental code deployments reducing risk when issues emerge. However, sufficient testing remains vital avoiding detrimental hotfixes. Balance aims for hourly production releases assuming robust end-to-end automation. Be cautious comparing rates across company departments if differing systems and code complexity.
3. Change Failure Rate
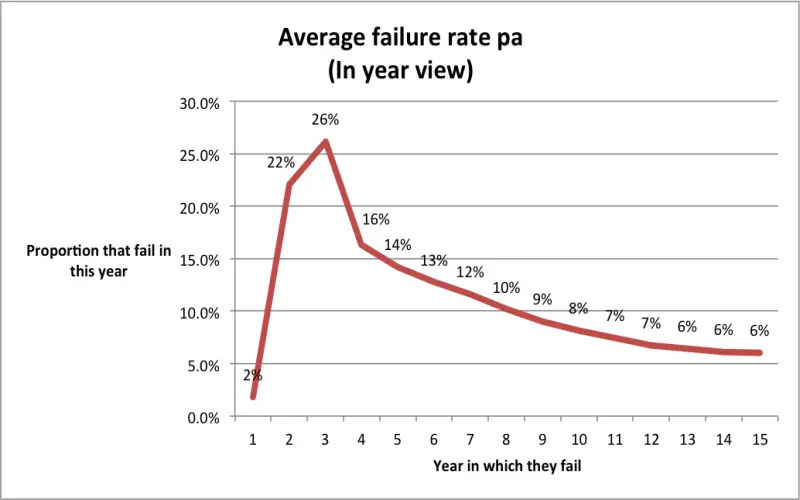
Representing the percentage of failed deployments entering production, the Change Failure Rate quantifies release stability. Chronicle issues around rollback workflows, smoke testing gaps, infrastructure weaknesses, and more influencing resilience. Discovery then guides targeted mediations lowering future failure rates. However, some failure proves an inevitable byproduct of innovation at scale. Strive instead towards semantic monitoring improving recovery times before outages tangibly impact customers. Leaders foster controlled experimentation cultures unafraid of occasional issues that nevertheless advance capabilities long-term.
4. Mean Time To Recovery (MTTR)
Despite best efforts focused on quality and risk reduction techniques, some small percentage of code changes inevitably still fail or cause issues after deployment to production systems once released to customers. Tracking the mean time to recovery for production incidents provides software teams with quantifiable data measuring how quickly they can address such defects or problems to limit negative impacts on users. Maintaining consistently fast and automated rollback capabilities for production systems proves essential for rapidly diagnosing issues and then reverting any faulty functionality or code changes when major bugs inevitably surface.
5. Customer Ticket Volume
While internally-focused development and operations metrics constitute important gauges for optimizing deployment pipelines and increasing release efficiency, analyzing customer support ticket volume levels comprises the most crucial barometer for measuring real-world user experiences. Carefully tracking and analyzing trends in customer-reported issues or problems provides unparalleled insights into potential weaknesses in quality assurance processes or existing production deficiencies regardless of what internal metrics may indicate. Without clear visibility at scale into customer tickets and user feedback, DevOps teams risk major gaps forming between internal release efficiency metrics and actual production quality outcomes.

6. Defect Escape Rate
To minimize negative customer experiences to the greatest extent possible, modern development teams strive to prevent any faulty code changes or uncaught defects from ever progressing downstream through later testing cycles and ultimately escaping into production environments. Tracking overall development defect escape rates provides quantified visibility for software teams into the real-world effectiveness and reliability of their full suite of quality assurance (QA) practices implemented throughout continuous integration pipelines. Lower defect escape rates enable faster release velocity as well as increased customer trust and satisfaction levels by preventing impactful bugs from ever reaching users.

7. Application Performance
Beyond just monitoring raw code defects, customers equally judge SaaS applications and digital experiences by more expansive performance measures extending well beyond strictly functional elements. Slow page load times, laggy web or mobile app interfaces, and intermittent availability or reliability frustrations can sink even the most feature-rich software solutions lacking in performance optimizations. By continuously monitoring production application performance using aggregated metrics such as load times, throughput, and uptime percentages, DevOps teams maintain crucial gauges on identifying optimizations required anywhere from product design through cloud infrastructure provisioning.

8. Mean Time To Detection (MTTD)
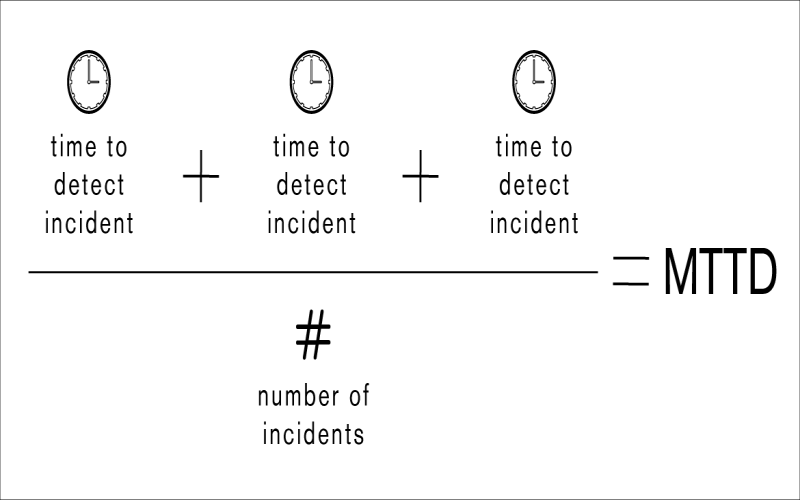
MTTD measures the average time taken to detect production defects from when introduced during test cycles. Lower MTTD means capable monitoring systems rapidly detect anomalies and offer a proxy for quality by indicating risks. For mission-critical systems, aim under 1 hour MTTD. Shortening the feedback loop from production to development matters. Detection depends on extensive logging, smart alerting, and automated rollbacks to investigate and patch before escalation.
9. Reviewers Per Code Review
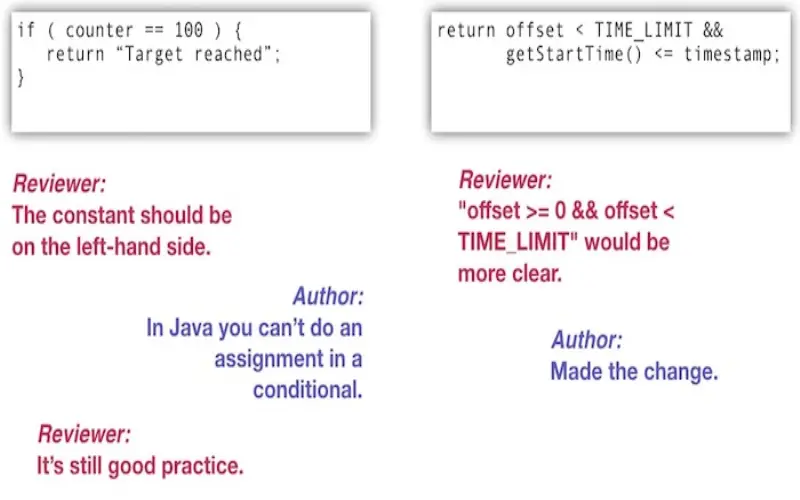
Optimal code review distributes accountability across reviewers with diverse expertise. Part of the balanced code review process requires at least 2 reviewers to inspect each pull request from planning to production. Reviewer bandwidth and coverage limit release velocity. Multiple reviewers per review drive higher-quality pull requests and accelerate learning. However overloaded reviewers create bottlenecks hindering productivity. Tracking reviewers per review ensures adequate capacity.
10. Percentage Of Code Reviews With Comments
Quantitative code review metrics provide limited insights. The percentage of reviews containing constructive feedback better indicates adequate reviews. Aim for over 75% of reviews having personalized feedback. Comments strengthen code quality by addressing issues like malformed logic, unclear naming, bugs, maintainability, and deviations from standards. They improve consistency and readability too. Meaningful oversight before merging depends on insightful peer review feedback.
