Every company deals with a lot of data, and analyzing it in its raw form is often difficult. The quality and accuracy of the data set you to work with increases as you present them in compelling graphs, charts, shapes, and plots. Tableau is the most commonly used data visualization tool. Tableau is a data visualization program that allows you to create basic graph-like data representations by querying cloud databases, spreadsheets, machine learning algorithms, social database assemblies, and other enhancements. So, in this blog, we’ll highlight the ten most essential Tableau features that help businesses visualize better.
10. Mobile View
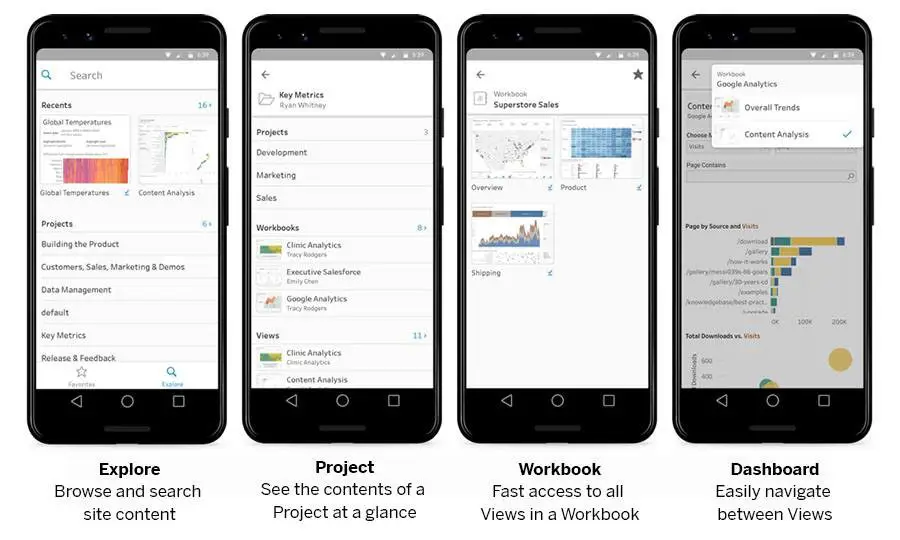
Tableau recognizes the importance of mobile in today’s world and offers a mobile version of the Tableau application. One can create its dashboards and reports in such a way that it is also mobile-friendly. Tableau can create custom mobile layouts for your mobile-specific dashboards. Customization options allow adding new phone layouts, interactive offline previews, and more. As a result, the mobile view gives Tableau users a lot of flexibility and convenience in managing their data on the go.
9. Advance Visualization Capabilities
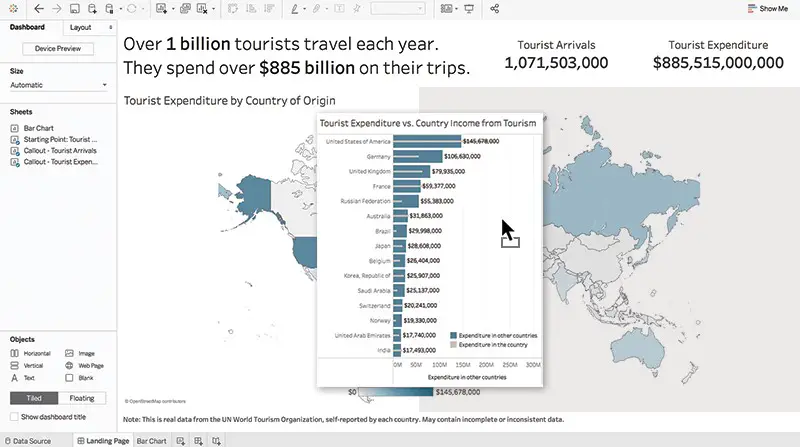
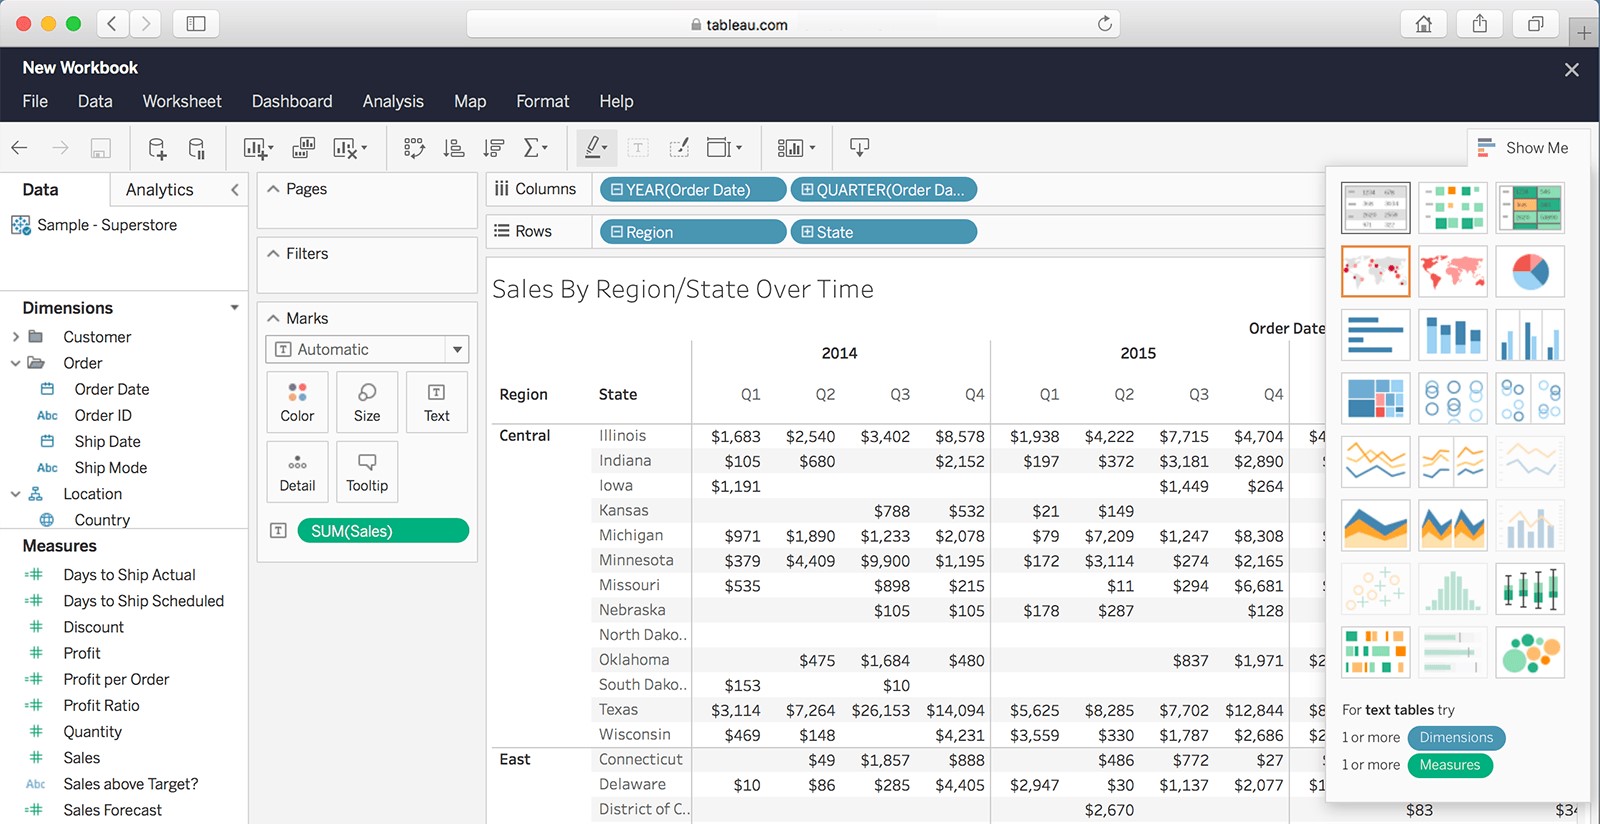
Tableau’s diverse image is one of the key factors contributing to its success. Tableau allows you to create simple visualizations like bar or pie charts and more complex visualizations like column charts, Gantt charts, bullet charts, dynamic charts, tree charts, box charts, and more. By choosing a visualization from the Show menu, you can select and create any visual shape.
8. History
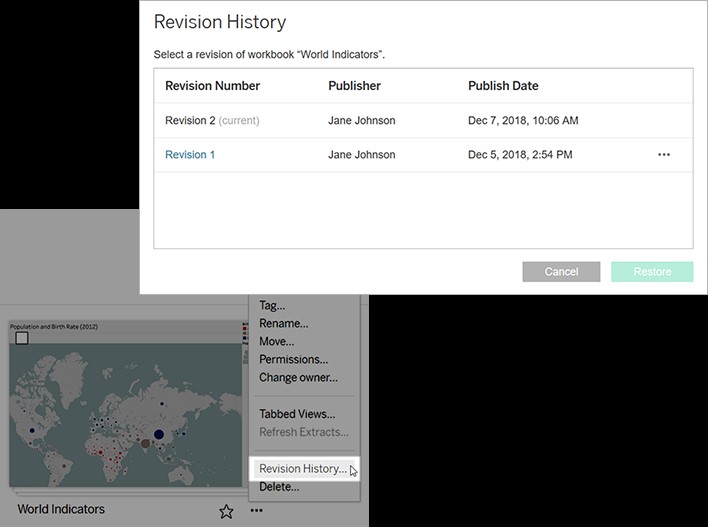
Revert to an earlier workbook version with one click in Tableau Server. You can restore older versions of your data sources by downloading and republishing them. You can limit the number of revisions on the Tableau Server Site Settings page.
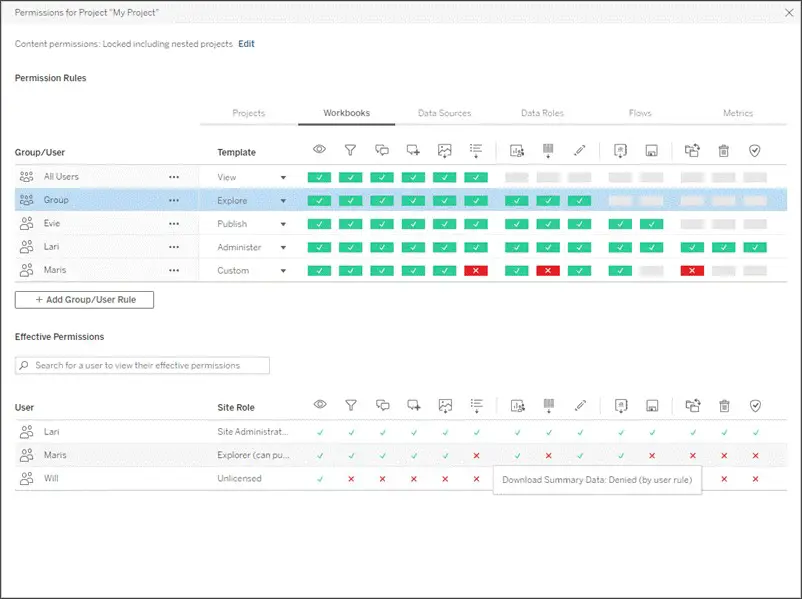
7. Role-Based Permission
With Tableau role-based permissions software, you can manage who has access to what data, and even define who can make changes to each data source or bookwork. From ensuring security to mitigating unintended changes to your data, Tableau Software, role-based permissions give you the ultimate in control.
6. Provides Good Security
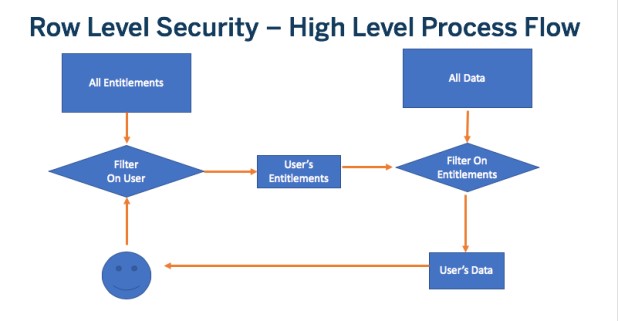
Tableau takes additional precautions to protect data and users. For data connections and user access, it has an insecure security system based on authentication and authorization mechanism. Tableau allows you to connect to other security protocols such as Active Directory and Kerberos. Tableau uses row-level filtering, which helps keep data secure.
5. Collaborating And Sharing
Tableau provides convenient options for collaborating with other users and sharing data instantly in the form of visualizations, sheets, dashboards, and more in real-time. It allows the user to securely share data from various sources like on-premises, cloud, hybrid, etc. Quick and easy collaboration and data sharing help get a short review or feedback on data, leading to better overall data analysis.
4. Licensing Views
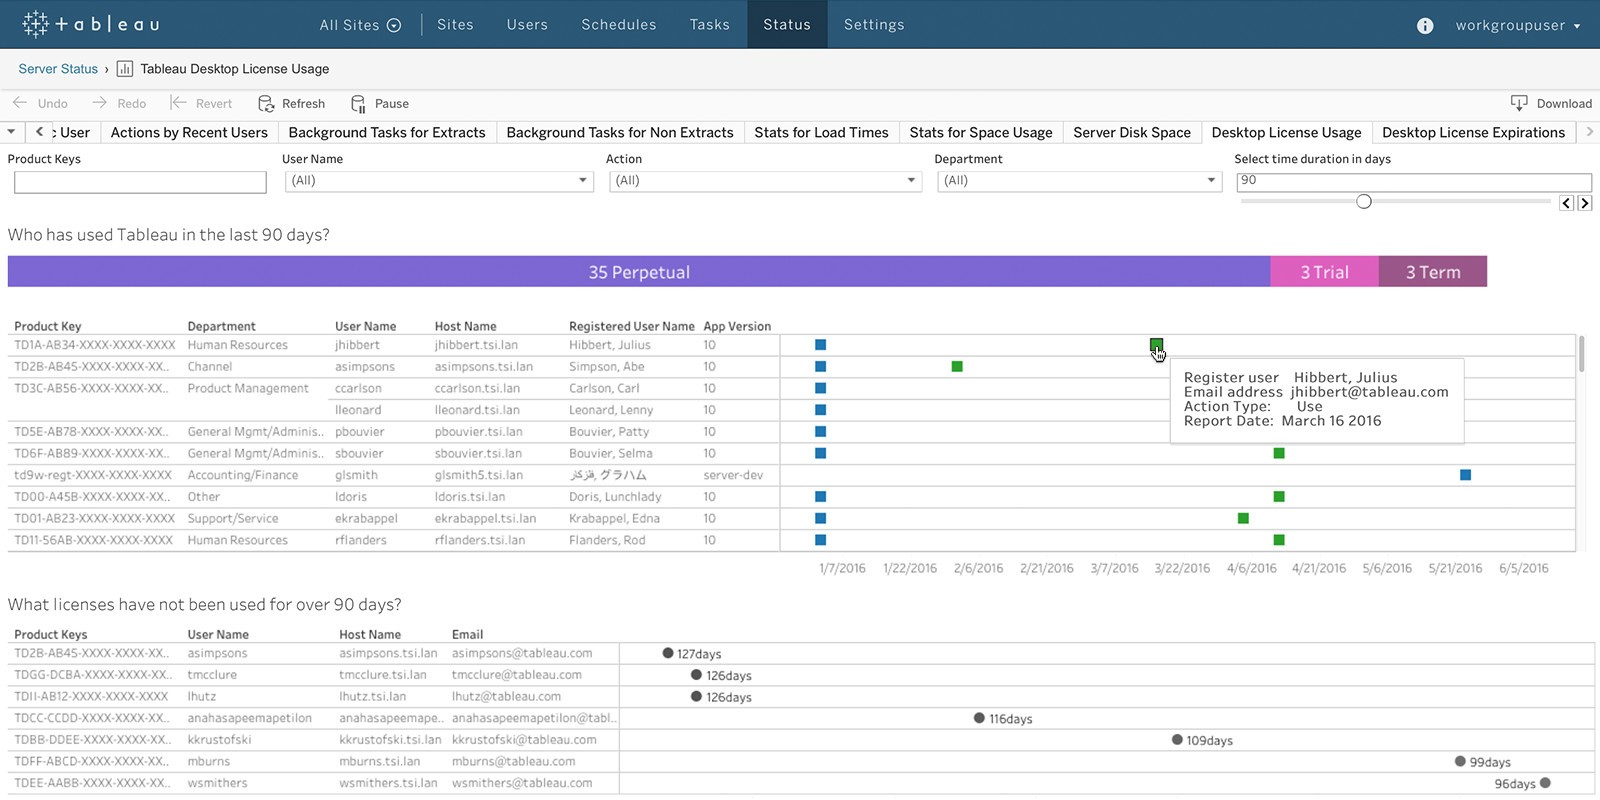
Tableau Server includes new administrative ideas that provide detailed information about licensing and using Tableau Desktop. Once configured, Tableau Desktop sends usage information to the Tableau Server in the background every eight hours, without needing to connect to the server.
3. Supports Numerous Data Sources
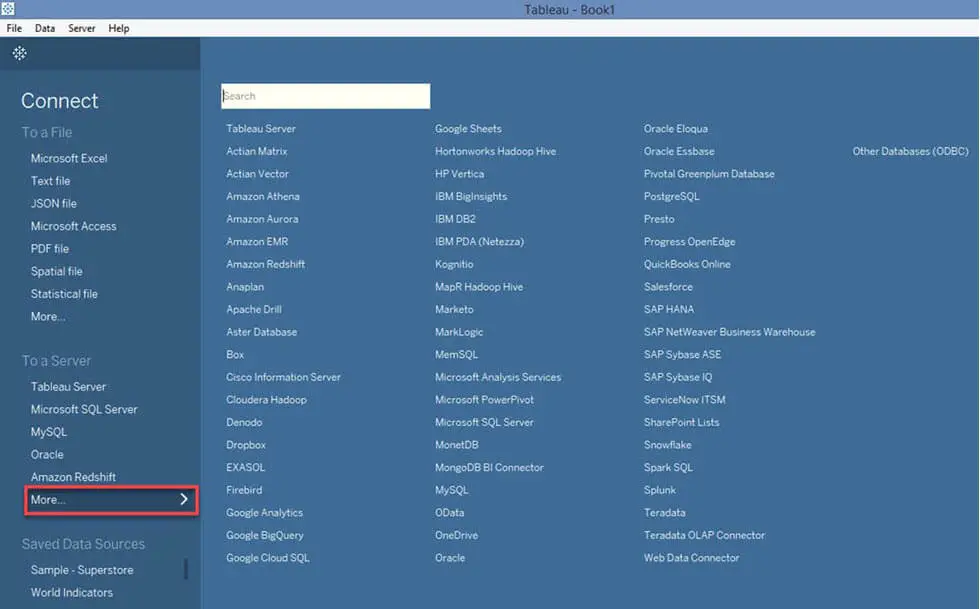
You can connect and retrieve data from various data sources using Tableau. Tableau supports many data sources, including local files, spreadsheets, relational and non-relational databases, data warehouses, big data, and cloud data. All Tableau data sources can be easily connected and combined with data from other sources to create an aggregated view of the data in a visual form. Tableau also supports different data connections, including Presto, MySQL, Google Analytics, Google Sheets, and many more.
2. Real-Time Analytics
With Tableau real-time analytics software, your data is updated automatically or at selected intervals to give you a real-time view of your most important metrics. You can access real-time sales reports, area performance, and inventory metrics. Tableau’s detailed viewing capabilities can drill down into the data to answer any of the following business questions.
1. Dashboard
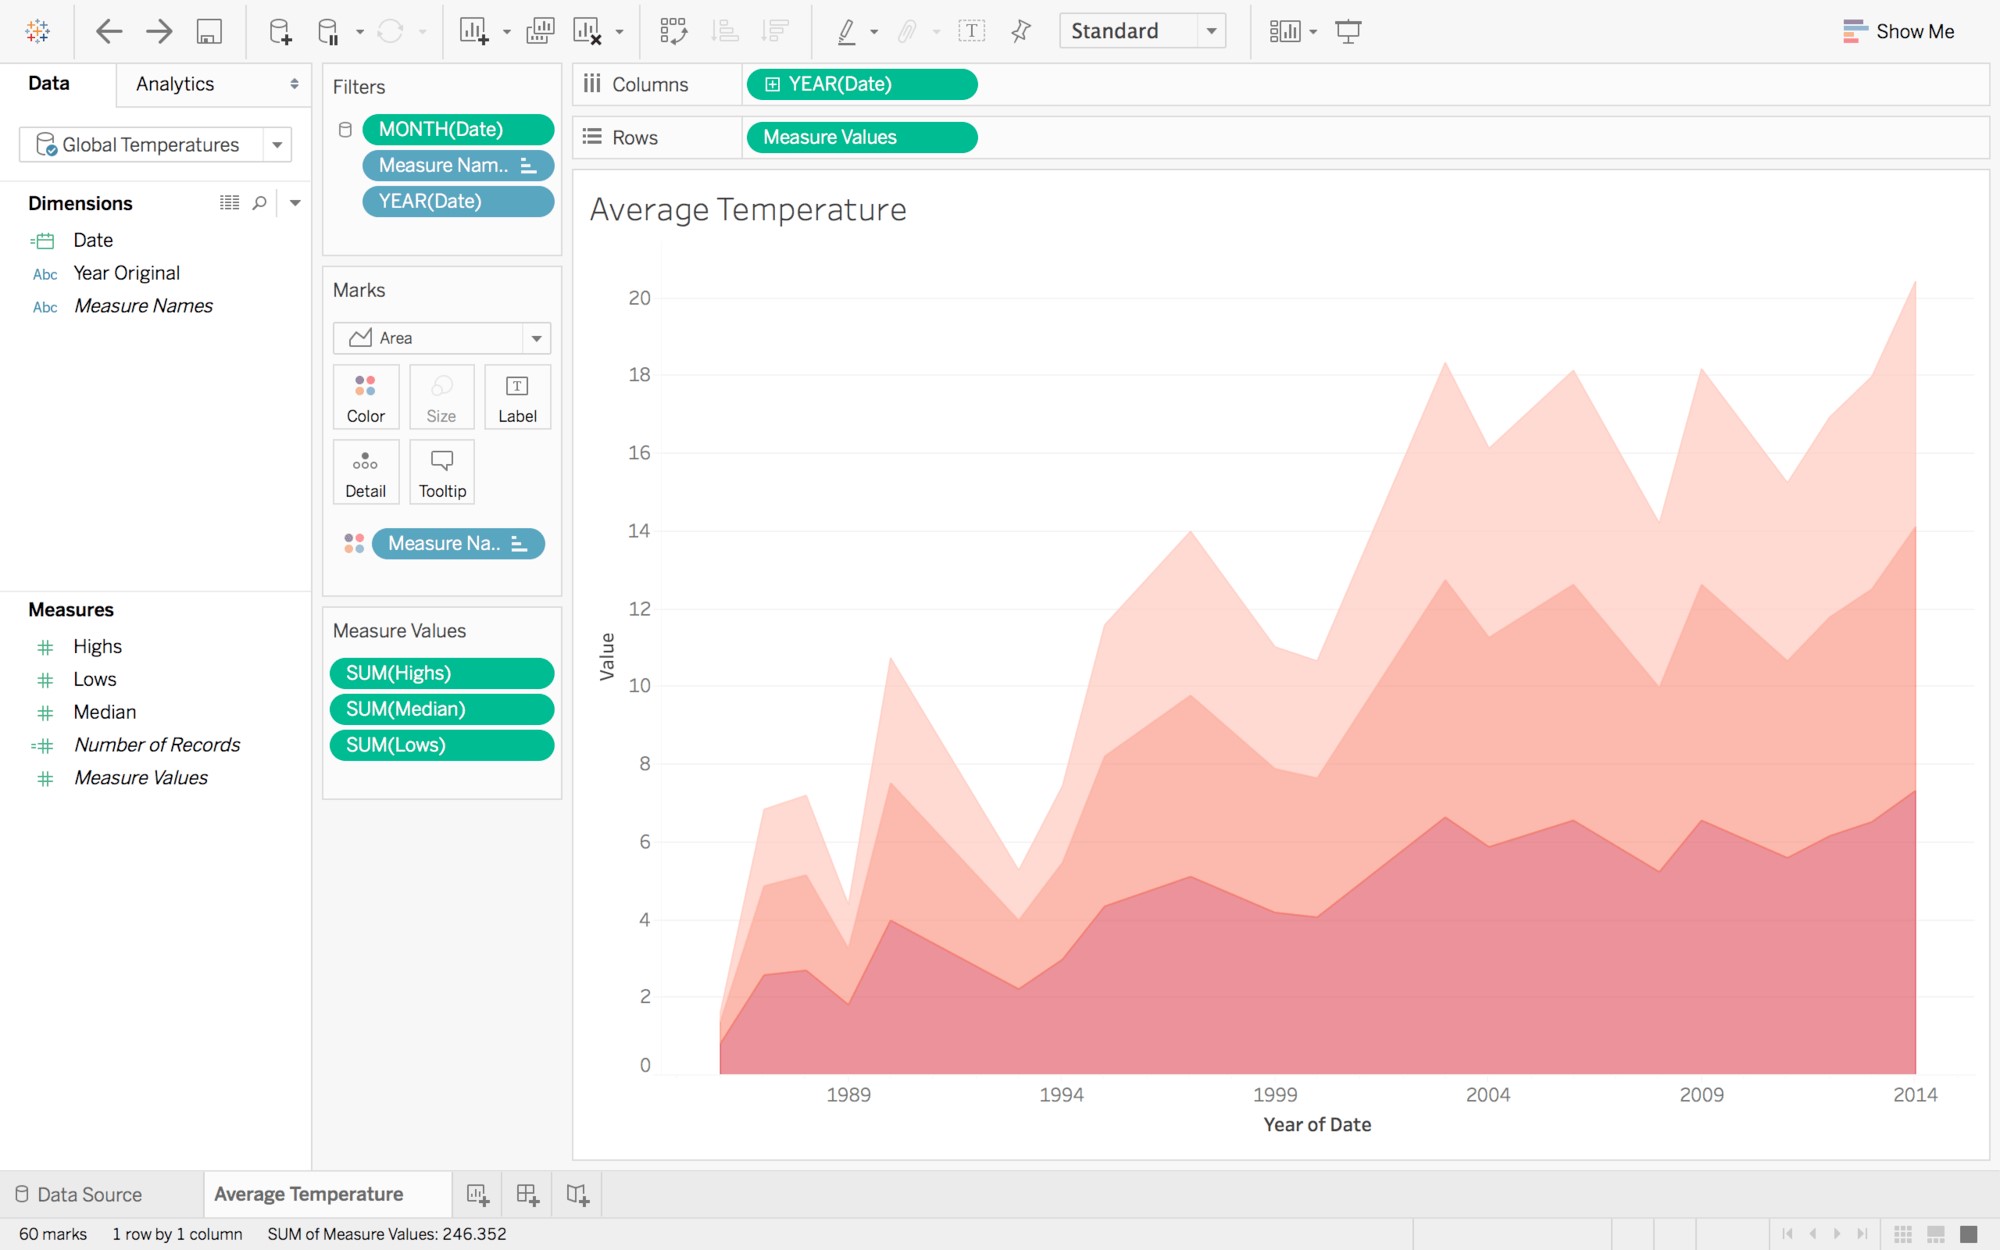
Tableau dashboards provide a complete view of your data through visualizations, images, text, and more. Dashboards are very informative because they can present data as a story, allow multiple pictures and objects to be added, provide a variety of layouts and formats, and allow users to implement appropriate filter fit. You can easily copy the dashboard or its specific elements from one workbook to another.


