Visual analysis tools are sophisticated software programs or platforms that enable users to explore, interpret, and effectively communicate insights derived from a wide range of visual data sources. These tools employ cutting-edge data visualization techniques to relay complex information in a visually appealing and easily understandable format. Essentially, the primary aim of visual analysis tools is to help users identify patterns, trends, and relationships within their datasets that would otherwise go unnoticed using traditional numerical or textual analysis methods. By visualizing data, these tools empower users to make data-driven decisions, gain new perspectives, and communicate their findings clearly and concisely.
Modern visual analysis tools are designed to provide a wide range of interactive features and chart types (e.g., bar charts, line charts, scatter plots, heatmaps, and more), all aimed at enhancing data exploration and analysis. They also allow for customized chart appearances, such as color schemes, labels, and annotations to suit individual preferences. These features make it easier for users to interpret data, identify patterns, trends, and outliers, and gain valuable insights that guide effective decision-making.
1. Data Visualization
There are several categories of visual analysis tools available, each offering unique capabilities to users. For example, Data Visualization tools offer a broad range of visual representations such as tree maps, bar charts, line graphs, scatter plots, heat maps, and more. These representations make it easier to identify subtle patterns, trends, and outliers within the data which are often hard to spot with other analysis methods. Users can easily customize and adapt the appearance of visualizations to suit the specific visual needs of their data, including color schemes, labels, and annotations, which all enhance clarity and understanding.
2. Interactive Dashboard
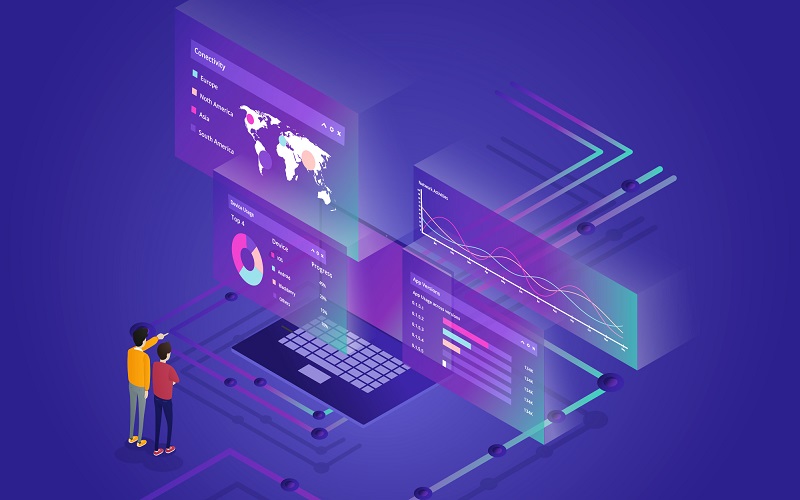
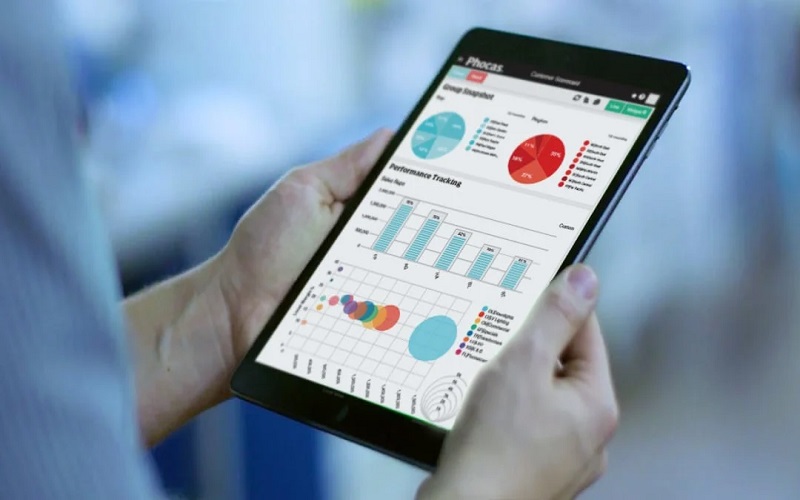
Interactive Dashboards are another category of visual analysis tools that provide a consolidated view of several visualizations and critical metrics in one cohesive platform. Users can arrange these components according to their preferences and conveniently drill down into precise data points, apply filters, and explore various aspects of the data dynamically. With dashboards, users can get an at-a-glance summary of their data which facilitates ongoing monitoring and decision-making.
3. Data Exploration
Data Exploration tools also offer interactive data exploration capabilities, allowing users to zoom in and out of visualizations, navigate through different levels of detail, and interpret data points to reveal underlying information. Filtering and segmentation options help users to hone in on specific subsets of data for more in-depth analysis. This interactivity enables users to uncover intricate correlations, identify the most crucial insights and ask new questions about their data.

4. Data Integration
Data Integration tools provide connectors and integrations with numerous data sources such as databases, spreadsheets, cloud storage platforms, and online services. These integrations enable seamless data import and aggregation, allowing users to combine data from disparate sources into one comprehensive analysis. Users can work with real-time data or even schedule updates to keep their analysis up-to-date. Overall, visual analysis tools offer a powerful resource that leverages data visualization techniques to assist users in gaining insights from complex datasets, ultimately enabling effective decision-making and communication of findings.
5. Advanced Analytics
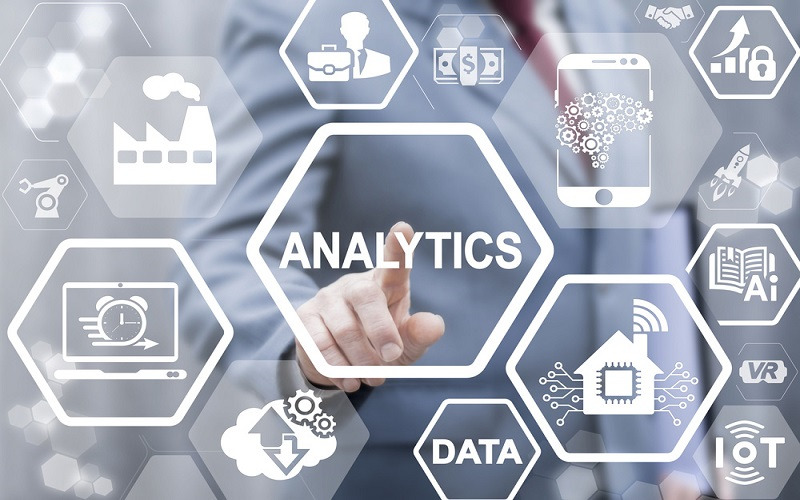
Visual analysis tools offer advanced analytical capabilities such as statistical functions that help users calculate measures like mean, median, standard deviation, and correlation coefficients without requiring additional tools. Predictive modeling features also enable users to build and evaluate predictive models without advanced programming skills. Other analytical techniques such as clustering, regression analysis, and time series analysis help uncover complex relationships and make data-driven predictions.
6. Collaboration And Sharing
Visual analysis tools have collaboration features that aid in teamwork and knowledge sharing. Through various channels, users can share their analysis results, dashboards, and visualizations, and these tools usually enable users to export their visualizations as images or embed them in presentations or reports. These tools even provide functionalities that allow multiple users to work on the same analysis simultaneously and leave comments for discussion.

7. Real-Time Data Monitoring
Real-time data monitoring can be achieved using some visual analysis tools because they allow users to connect with streaming data sources. This is particularly useful in scenarios where immediate insights are required, such as social media monitoring or real-time sensor data analysis. Users can monitor their data in real-time and create visualizations that update dynamically as new data arrives, enabling them to detect trends, anomalies, and emerging patterns as they happen.
8. Data Storytelling
Visual analysis tools are equipped with storytelling capabilities, which help users effectively communicate their insights. Users can create data-driven narratives by combining annotations, text, and visualizations. They can guide their audience through a story by sequencing visualizations, highlighting significant findings, and explaining the context. Storytelling features are useful to present one’s analysis compellingly and engagingly, making it easier for stakeholders to understand and act upon the insights.
9. Predictive And Prescriptive Analytics
Advanced visual analysis tools incorporate machine learning algorithms and AI-driven capabilities to perform predictive analytics and suggest optimal courses of action based on analysis results. Users can have insights into the future and beyond descriptive analysis, enabling more informed decision-making.

10. Customization And Extensibility
Visual analysis tools are that provide options for customization to suit individual preferences and specific use cases. These tools provide customization options for colors, fonts, layouts, and dashboard interface components. Additionally, these tools offer APIs and software development kits (SDKs) that allow developers to create custom extensions and integrations, enabling users to extend the functionality of the tool and integrate it with other systems or workflows.


