Stock charting software allows you to make technical analysis easily. Investors use a stock charting software and this type of software is especially useful for investors who are new to stock market investing. Learn more about plotting stock charts using such software. Experiment with technical analysis features in this software. Create charts based on time. Make better trading decisions using the technical analysis you make with the help of stock charting software.
1. TradingView
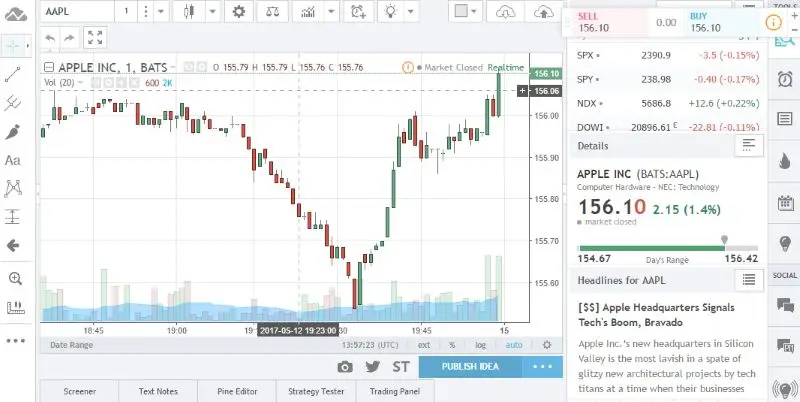
TradingView is a free stock charting software that makes trading faster. Follow your favorite assets and find trading ideas using this software. Spot trends and chat with others using this software. Place trades directly on this platform, look up the latest stock prices and analyze price patterns using this software. Compare symbols and get financial data from charts. Intelligent drawing tools are available in this software with popular pre-built indicators, and the multi-timeframe analysis is available in this software. Get twelve different alert conditions for any situation in the market. Discover investment ideas from the large trading community in this software.
2. Stock Rover
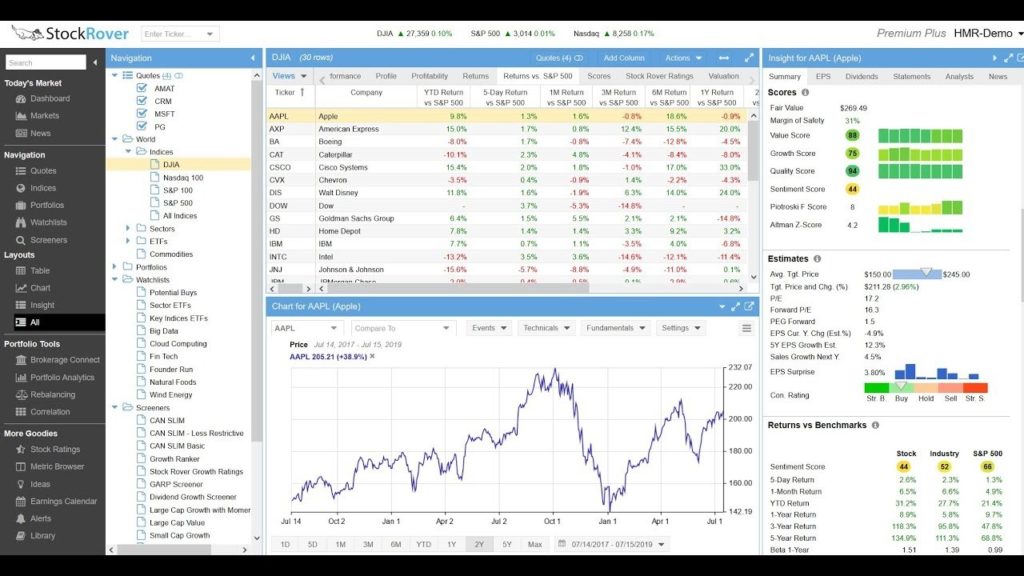
Stock Rover is a stock charting software that displays up to three Simple Moving Average(SMA) lines. These lines highlight the overall trend in stocks. Candlestick charts in this software will show all the range of prices from high to low. Ratio charts allow you to compare two stock trends, and portfolio charting allows you to view your portfolio performance. Your portfolio activity will show the shares you have purchased and sold. Compare the total return performance of the portfolio against your benchmark.
3. TC2000
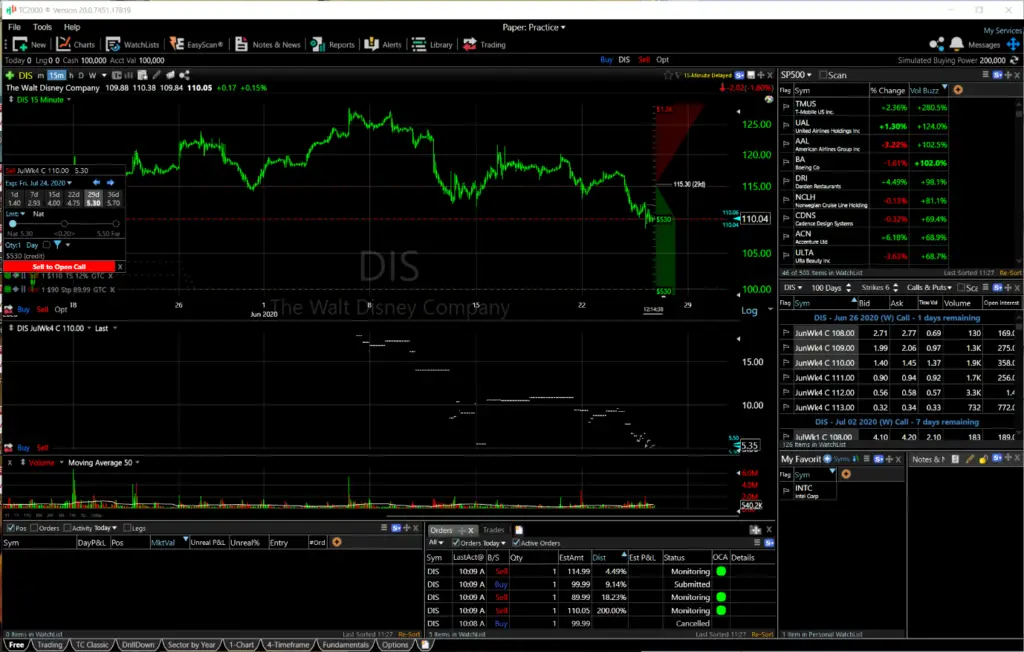
TC200 is a stock charting software that is fast and stable to use. It has a historical condition testing feature and allows you to scan plots easily. Colour bars are available to display stock charts easily. Change symbols and sort data to plot them in a fast manner using this software. Time-saving concepts are available in this software that allows you to work efficiently. The trading simulator allows you to practice in this platform and learn from it. A basic layout with a chart and personal journal options are available in this software. Zooming options and stunning graphics are what you can expect from this software.
4. StockCharts
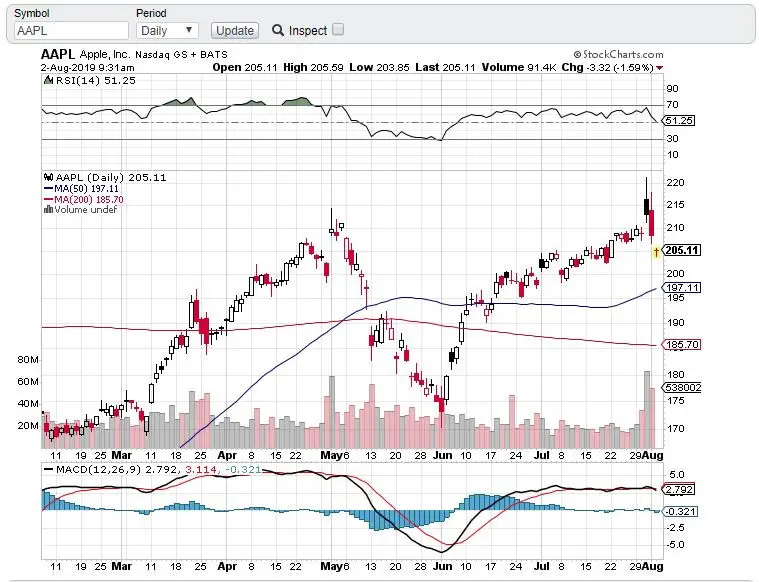
Use Stockcharts to do stock charting easily. This website contains all the charts and tools you need to make your stock charting. Advanced resources are available for analysis. Watch a broader market or individual stock using various charting tools available. Monitor your portfolio by organizing your charts. Access charts from all your devices using this website, which makes management easy. Find investment opportunities using scanning and alert feature available in this software. Save your chart with annotations in this software. Various indicators are available with real-time intraday data to make charting advanced. View your charts in multiple formats. Create custom technical alerts.
5. Yahoo Finance
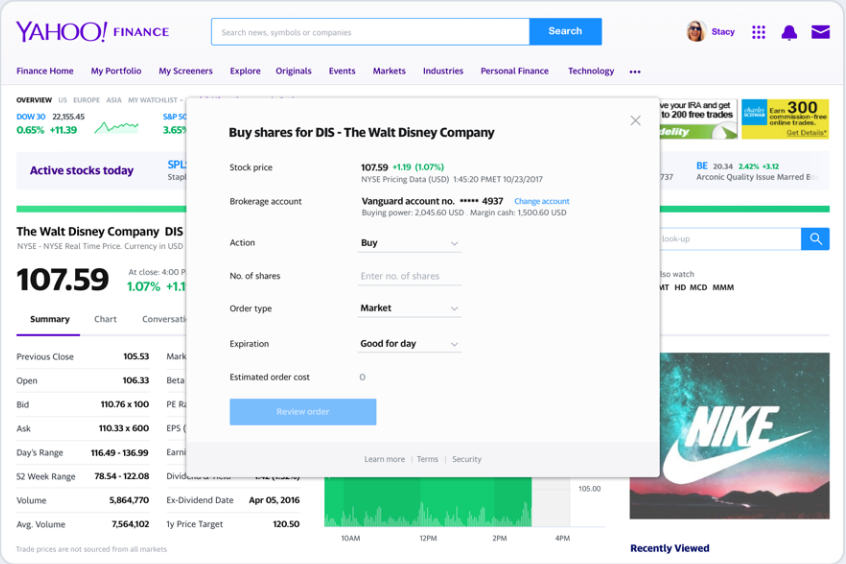
Yahoo Finance is a stock charting software useful for traders who use see a forecast of stock prices. They recognize trends and patterns in charts—spot opportunities to earn money through such stock charting software. Line charts are available to show you stocks over some time. Bar charts show detailed information on the daily price and trading range. Financial technicians prefer candlestick charts. This type of charting allows you to read price movements easily. Different colors are used in this chart to highlight particular stock changes. You can make many such types of charts using this software.
6. ChartNexus
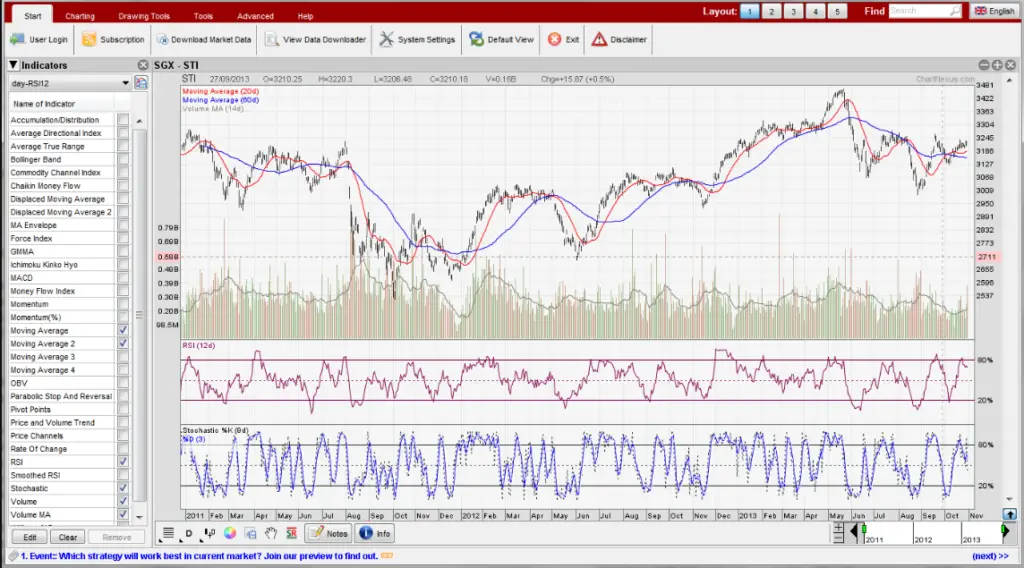
ChartNexus is charting software that traders and investors use. Lower your operating cost by using such software. Get three-year end of day data updated daily for free in this software. A list of popular indicators is available in this software. Get free access to market data and make charts easily. A multi-window charting option is available so that you can arrange a chart as per your wish. The search tool in this software allows you to search easily. Use the workspace to save notes. Various tools are available for drawing shapes. View linear and logarithmic price sales using this software.
7. Robinhood
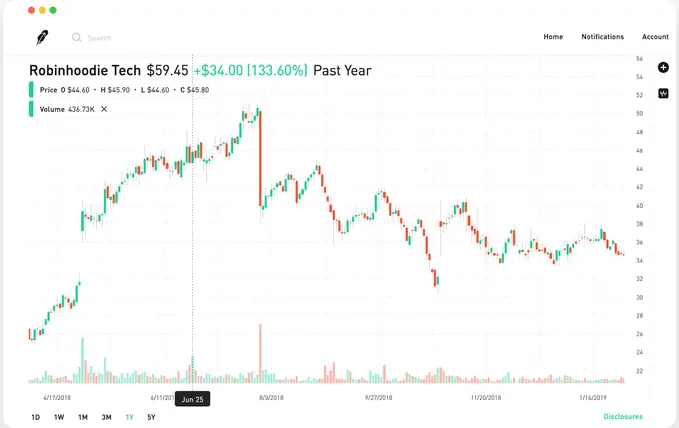
Robinhood is a stock charting mobile application that allows you to make candlestick charts. This type of chart allows you to look at a lot of information about stock prices efficiently. It shows the increase or decrease in stock prices in a period. Switch between the line chart and candlestick chart on your mobile while using this application. Colors are present in this software to differentiate the rise and decline in stock prices easily. Investors can view the total number of shares traded and understand the interest rate of a stock.
8. Reuters
Reuters acts as a gateway to the world’s market through stock charting. Get the stocks of various countries in the form of charts. Get accurate stock details using this software. It has a news reporting feature that keeps you updated on all stock details throughout the world. The Red and green candlestick lines show the increase and decrease in stock prices. Can view the breaking news for stack on the chart, which makes it unique. View the global market easily with the help of this software.
9. Finviz
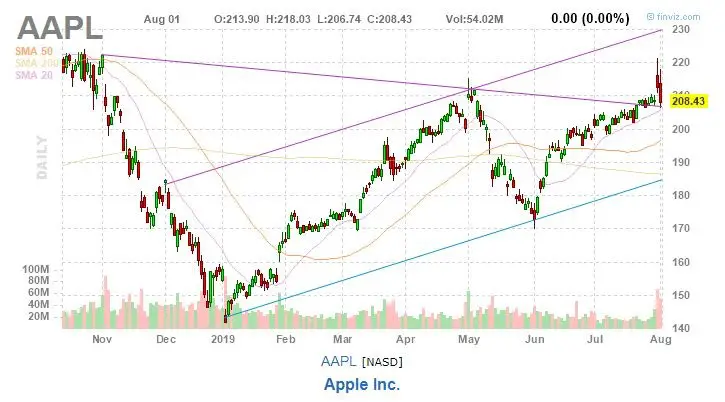
Finviz makes stock market research easier. Generate ideas, find trading opportunities, view market maps, and use comparative tools to track stocks. Get updates on financial news and track portfolios easily. The intuitive dashboard and data visualization options allow you to analyze stock charts easily. Users can use many indicators as input to identify stocks that fit their criteria—filter stocks based on price or volume. Get an overview of how various sectors are performing. Get to choose the way to display your chart from the bar chart to tabular form. View how cryptocurrencies are performing in the market. Track the progress of future markets using Finviz.
10. MSN Money Central
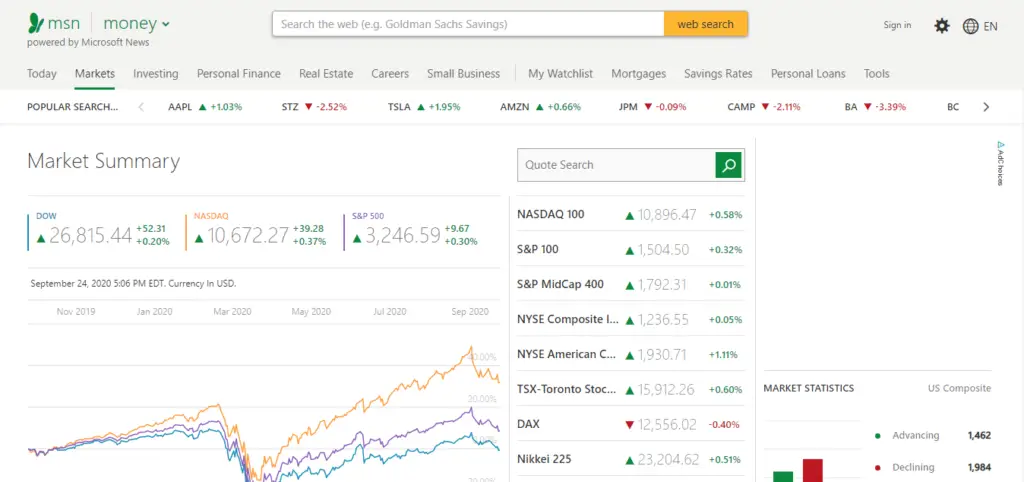
MSM Money Central is a stock charting software available on a mobile phone. It allows you to know more about financial data—Track major indexes around the world. Add your favorite stocks to your watchlist to keep an eye on them. Synchronize your watchlist from the web to this application easily so that you can access stock details from anywhere. Get advice on financial markets and personal investments you can make. Get budgeting tools using this software to know how to set your budget. Track the exchange rates of the currency in this mobile application.


