A network monitor verifies the functionality of the network devices. The network-attached device, workstations, and servers are just a few of the various devices that this application can keep an eye on. If any gadget stops responding, you will be informed. The SNMP (Simple Network Management Protocol) protocol is used by some tools. It will retrieve operational information from the monitored devices, such as a processor or memory usage. The network administrators will benefit from knowing about the overall condition of the network.
1. SolarWinds Network Performance Monitor
SolarWinds Network Performance Monitor installs quickly. The utility detects and deploys network devices in an hour. It has one of the most straightforward and intuitive user interfaces for network management. The UI is easily managed and customized. Customize web-based performance dashboards, charts, and views. Your network infrastructure topology can be customized. Customize dependency-aware intelligent notifications and more. Use-based software modules are sold. SolarWinds Network Performance Monitor costs $1,995 for a one-year license with maintenance. SolarWinds NPM is a top network monitoring solution due to its extensive feature list.
Highlights
- Automatically Discovering and Scanning Wired and Wireless Computers and Devices
- Forecast and Capacity Planning for Multiple OEMs
- NetPathTM Critical Path visualization pinpoints network performance issues quickly.
- Performance Dashboard for Network Data Analysis
- Robust Alerting System for Simple/Complex Triggers
- New Network InsightTM for CISCO ASA monitors networks.
- Cisco ASA ACL, VPN, Interface, and Monitor
- Firewall Rules Monitoring Browser Hop-by-Hop Critical Network Path and Component Analysis
- Discover Networks and Map Topology Views Automatically
- Dashboard Wifi Network Management, Monitoring, and Analysis
- HeatMap Wifi Networks to find Dead Spots.
- Check Servers, Firewalls, Routers, Switches, desktops, and laptops for Hardware Health.
- Critical Network Components and Devices Real-Time Network and Netflow Monitoring.

2. Auvik
Auvik, a SaaS tool, automates enrolling and monitors network infrastructure changes. This system combines site monitoring. Thresholds automate Auvik’s network monitoring. Most network monitor metrics have out-of-the-box entries. Create custom thresholds. The monitoring service alerts when thresholds are crossed. For example, technicians can focus on other duties knowing that the entries provide time to prevent user-visible system performance issues. Configuration management in the Auvik package standardizes network device settings and prevents unwanted changes. Cloud servers power Auvik. Each monitored site must have collectors, though. Ubuntu and Windows Server support this program. VMs can run the collector. The system manager can use any Web browser to view the Auvik-based service interface from anywhere the collector is.
Highlights
- A SaaS package with processing power, system log storage, and monitoring tools.
- Centralizes multiple site network monitoring.
- Monitors network devices.
- Two options Performance-based
- Higher-plan network traffic analysis
- monitors actual and virtual LANs
- Autodiscovery
- Network alerts
- Third-party integrations

3. Datadog Network Monitoring
Datadog monitors network device performance. The cloud-based service can discover all networked devices. Using this research, the network monitor will produce an asset inventory and topology map. This means the system setup itself. Autodiscovery detects network changes and rapidly updates the inventory and topology map. In addition, the service can see virtual systems and monitor connectivity to cloud resources. Datadog Network Monitoring monitors all connections and correlates performance concerns with log reports. In addition, any browser can access the cloud-based system dashboard. This aggregates network performance data from multiple sources and covers the complete network, link by link.
Package Features
- Monitors networks remotely.
- integrates cloud and on-premises resource monitoring
- Integrates Datadog modules like log management
- Shows network performance and device details.
- Performance dependencies help troubleshoot.
- DNS monitoring
- SNMP device reports
- combines many performance data sources
- Data flow monitoring
- Dashboard tag-based packet analysis utilities
- Protocol analyzers
- Machine learning-based performance thresholding
- Performance issue alerts
- Packages include traffic analysis or network device monitoring software.
- No-startup subscriptions
- The software can dynamically change custom graphs, metrics, and alarms. For example, the database is free (up to five hosts), Pro $15/host/month, and Enterprise $23/host/month.
4. Paessler PRTG Network Monitor
PRTG Network Monitor is noted for its advanced infrastructure management. Your network devices, systems, traffic, and applications can be shown hierarchically to summarise performance and alarms. In addition, PRTG monitors the IT infrastructure via SNMP, WMI, HTTP requests, REST APIs, Pings, SQL, and more. It is ideal for enterprises with little network monitoring software experience, but the UI is robust and straightforward. PRTG’s mobile app can monitor data center devices. The hardware has a QR code that matches the sensor. The mobile app scans the code and displays a device summary.
Highlights
- Device inventory autodiscovery
- Live network topology maps come in many formats.
- WLAN/LAN monitoring
- Multi-site monitoring
- SNMP sensors for device health data Ping for availability
- Server and application sensors are optional.
- System-wide status overviews and device-specific drill-downs
- High-traffic application protocol analyzer
- a packet sniffer for header analysis
- Dashboard graphs displaying live data are colored.
- Planning capacity
- A device, resource, and performance alerts
- Email or SMS alert notifications
- Windows Server installation or hosted cloud service
5. ManageEngine OpManager
This network administration tool balances monitoring and analytic features. The solution manages servers, network configuration, fault & performance, and network traffic analysis. Manage Engine OpManager requires on-premises installation. Its pre-configured network monitor device templates are a plus. These have device-specific monitoring parameters and intervals.
The $595 essential edition supports 25 devices.
Highlights
- Server and network monitoring
- Network inventory autodiscovery
- Constant device availability checks
- Network topology map choices
- Automated network mapping acts as an SNMP manager, continually checking device health.
- Receives SNMP Traps and detects device problems Implements performance thresholds and identifies system problems
- monitors resource availability
- Dashboard with live data dials and graphs.
- Sends email or SMS alerts.
- Linux/Windows Server compatible
- Creates a full-stack supervisory system with an application performance monitor.
- Distributed version to manage several sites centrally.
6. Progress WhatsUp Gold
WhatsUp Gold from Progress Software Corporation tracks network performance using SNMP. SNMP agents on switches and routers regularly update status reports, waiting for an SNMP manager request. Regular operating systems lack an SNMP manager. That’s WhatsUp Gold. This monitoring tool transmits MIB status requests regularly. WhatsUp Gold collects the responses from each device agent. This method informs the system about all devices and their connections. The service also generates a network topology map from live network inventory changes. Windows Server installs WhatsUp Gold. Different pricing plans fit your network and wallet for this program.
Highlights
- SNMP manager
- Auto-discovery creates a network map.
- Live network performance data
- Time-series device history charts and graphs
- Displays a network status summary.
- Trend analysis and traffic generators aid capacity planning.
- Covers LANs and wireless networks
- Manages logs
- Alerts device issues
- monitors cloud and storage devices
- Add-ons monitor bandwidth, virtualizations, and programs.
- Configuration add-ons
- Multi-tenanted for MSPs.
- Distributed monitoring allows central supervision of numerous sites.

7. Site24x7 Network Monitoring
Site24x7 monitors networks, servers, and applications. This package’s network monitoring service searches for connected devices. In addition, it creates a network inventory and topology map. The Network Monitor queries devices every minute using SNMP. These answers update the inventory and topology map with network infrastructure updates. The monitor dashboard displays live device replies, and any browser can access and configure the dashboard. If SNMP device agents discover an issue, they can deliver a warning without a request. Traps alert Site24x7 Infrastructure of these communications. Technicians can receive this warning via SMS, email, voice call, or IM. Network Monitor analyses traffic. The system dashboard displays data flow from switches and routers. Capacity planning can use this data.
Highlights
- Cloud-hosted CPU time and performance data storage.
- Uses SNMP to monitor device health on-site worldwide
- Provides resource, performance, and device warnings
- Sends email or SMS alerts.
- Root-cause analysis
- Network device inventory autodiscovery
- Auto-topology mapping
- Includes VPN performance monitoring.
- Storage cluster-specific monitoring
- Watches edge services like load balancers.
- Provides network and device performance overviews and details.
- network traffic monitoring
- Capacity planning and bottleneck detection
- Integrates with application monitoring services for complete stack service

8. Atera
Atera is managed service provider bundle software, and its SaaS platform incorporates PSA and RMM solutions. Windows Server agents run the network monitoring system remotely. The agent helps the service find all network devices that run it. The agent manages SNMP for this. The agent may detect Traps, and device issues, using SNMP. Alerts appear on the Atera network monitoring panel. In addition, Atera offers automated topology mapping as an add-on to its subscription packages.

9. Domotz
Domotz, a SaaS platform, provides network monitoring, system administration, and workload automation. Domotz monitors using the Simple Network Management Protocol. The service can scan a network and inventory IT assets using this convention. Domotz uses inventory data to map its network. SNMP reports updating inventory and map. Status alerts are generated from SNMP responses on network issues. Domotz stores and displays data. This records performance for demand research and capacity planning. Each user has a password-protected account. This assigns each system action to a user. This control prevents carelessness and fraud through responsibility.

10. Nagios
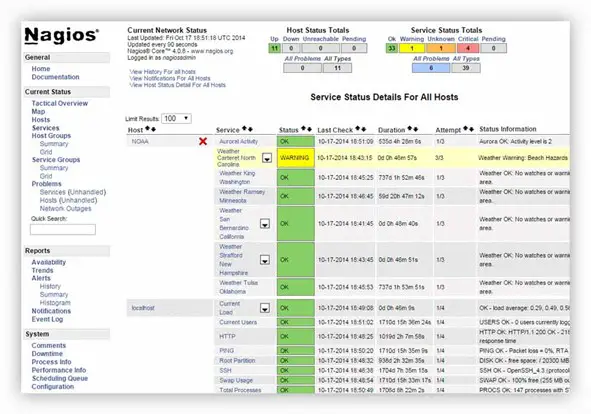
Nagios XI targets freelancers, SMBs, and large organizations. Nagios XI’s 14-day free trial is flexible, free, open-source, one-time license, and subscription. Due to its plug-in compatibility, it is one of the few technologies that offer low-cost versatility in monitoring and alerting. Nagios XI monitors. Nagios XI scans the network, infrastructure, and database. The software is straightforward to set up but takes time to customize. Nagios XI cannot auto-discover devices. Each monitored device needs a configuration file.
