There is a growing need for interpretable models as a result of the widespread adoption of artificial intelligence (AI) in a variety of businesses. Transparency and trustworthiness are improved as a result of interpretable models, which reveal how AI systems make decisions. The top 10 techniques for creating interpretable AI models will be covered in this article, allowing all stakeholders to fully comprehend and interpret the outcomes when people can grasp the outcomes and forecasts of the model easily. A model is simpler to understand and believe in when it can be used in a variety of ways.
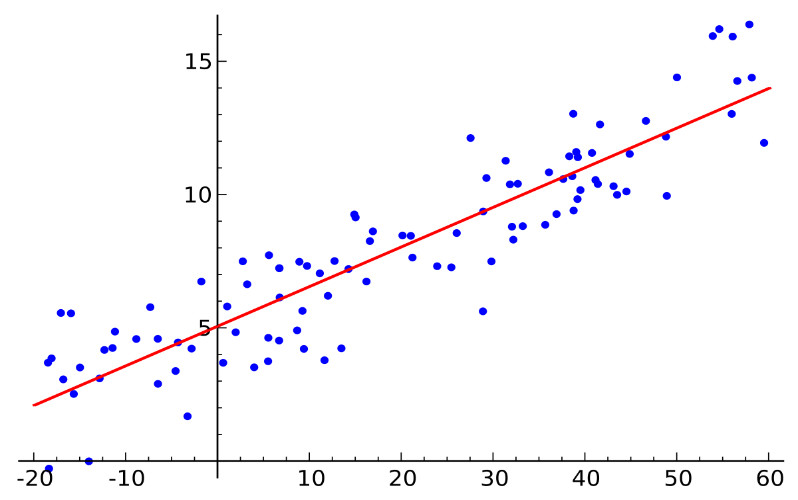
1. Linear Models
Like logistic regression, linear models are simple and easy to understand. Since they provide specific coefficients for each feature, we can understand how each input variable affects the outcome. Stakeholders can use the coefficients, which display the magnitude and direction of the link, to make informed decisions based on the importance of the feature.
2. Decision Tree
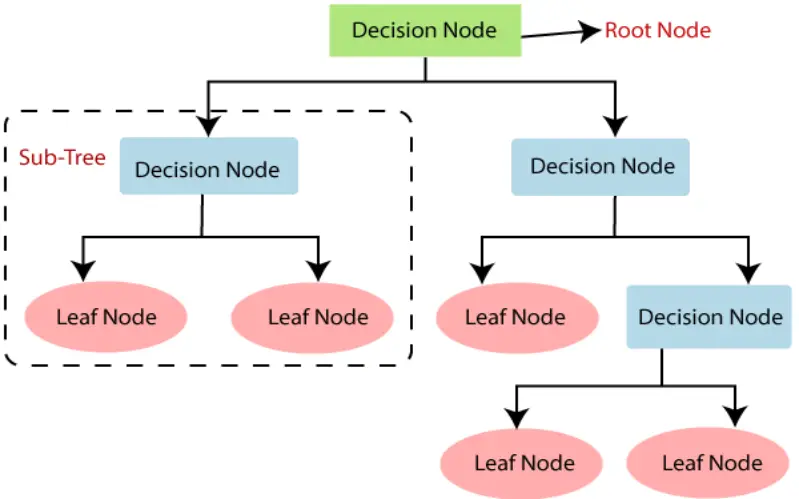
An intuitive method to analyze models is through decision trees. They illustrate the decision-making process using a tree-like structure, where each leaf node stands in for an outcome and each inside node for a condition. We can comprehend the series of events that led to a certain forecast by tracing the tree’s branches. Decision trees are used in industries where transparency is essential since they are simple to understand and visualize.
3. Rule-Based Models
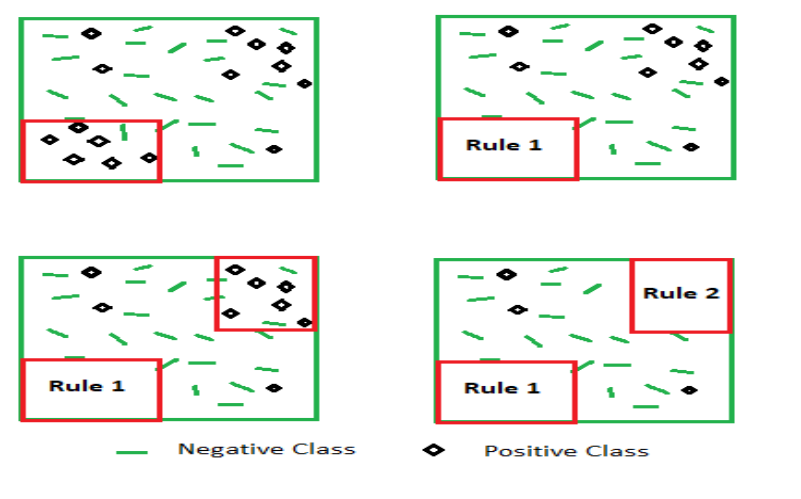
Rule-based models, commonly referred to as symbolic models, use an array of if-then rules to describe information. These rules can be developed from expert knowledge or extrapolated from data, and they are simple to comprehend. Rule-based models provide transparency and interpretability by expressing the prerequisites for various outcomes openly. Stakeholders can examine the rules to learn more about the decision-making process and guarantee that regulations are followed.
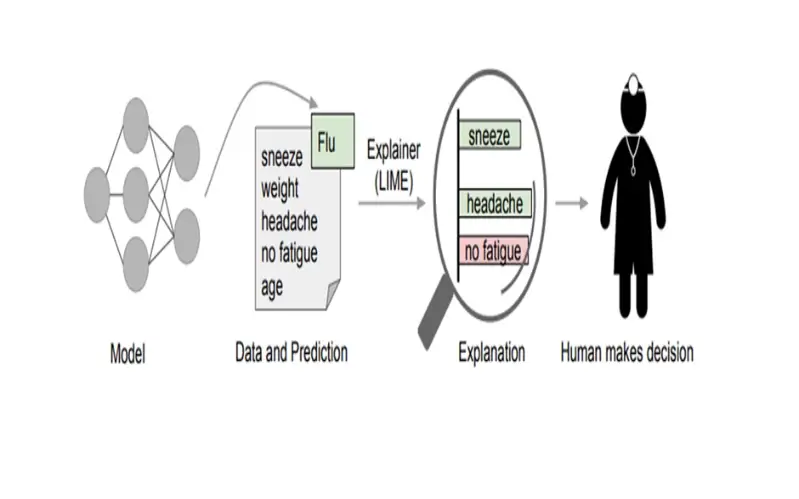
4. LIME (Local Interpretable Model-Agnostic Explanations)
The LIME method approximates the local behavior of a complicated model to explain individual predictions. By building a more straightforward model around a particular case of interest, it produces explanations that may be locally understood. To help stakeholders understand how each variable affects the prediction, LIME modifies the input character and tracks the outcomes.
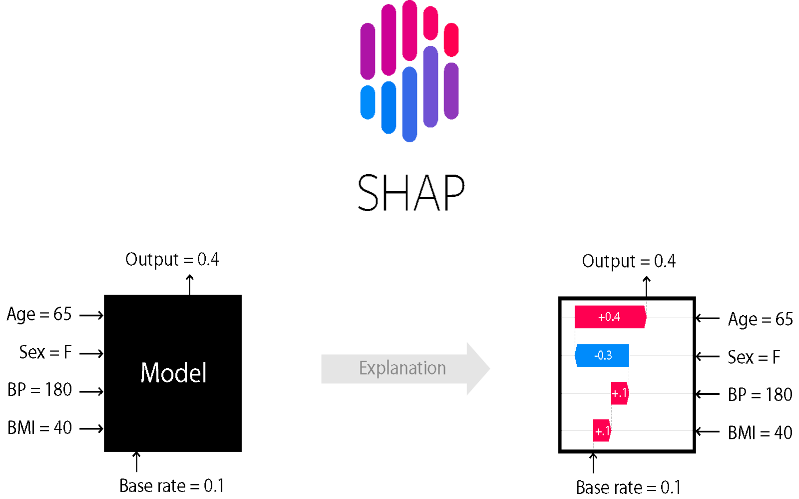
5. SHAP (Shapley Additive exPlanations)
Any machine learning model’s output may be explained using the universal framework known as SHAP. Based on the Shapley values from cooperative game theory, it gives each character a significant value. SHAP values offer a thorough insight into the behavior of the model by quantifying the contribution of each feature to the prediction. Stakeholders may determine the characteristics influencing the model’s predictions and evaluate their impact by looking at the SHAP values.
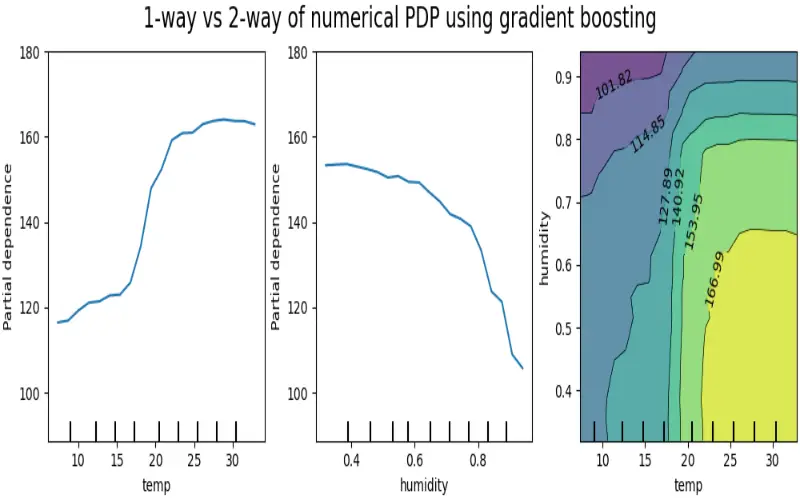
6. Partial Dependence Plots (PDPs)
Partial Dependence Plots (PDPs) minimize the influence of all other variables by focusing on the relationship between a target variable and a chosen characteristic. PDPs offer important insights into the behavior of the model by showing how changes in a single characteristic impact the model’s predictions. PDPs aid in understanding the link between input variables by visualizing the dependencies.
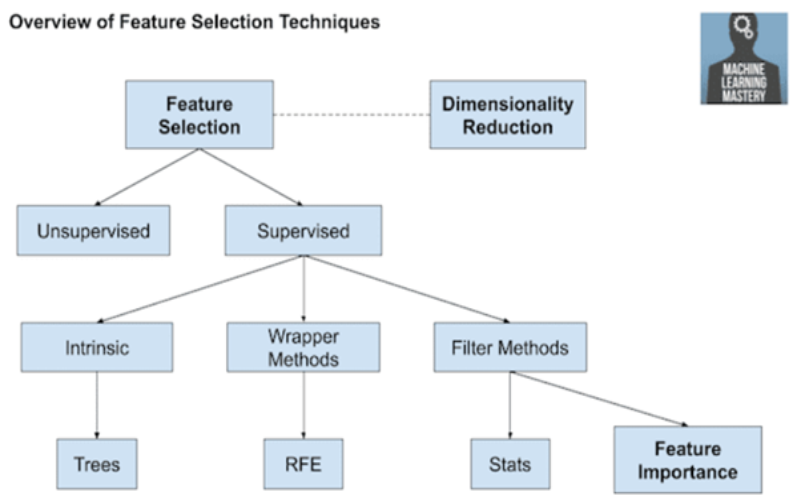
7. Feature Importance Techniques
Each input variable receives a score from feature significance approaches depending on how it affects the model’s predictions. These rankings, which are determined using techniques like permutation importance or Gini importance, aid in determining the most important traits and offer interpretability. Stakeholders can prioritize and concentrate on the crucial elements influencing the model’s judgments using feature significance strategies.
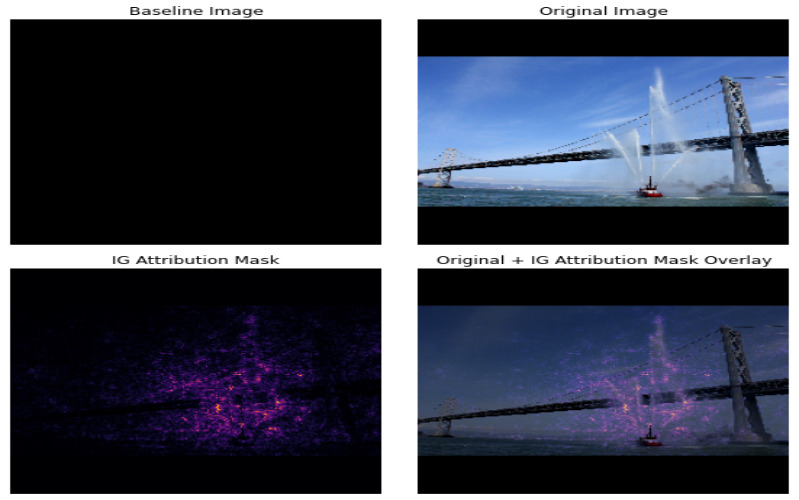
8. Integrated Gradients
By integrating gradients along the route from a baseline input to the desired input, the attribution method known as integrated gradients provides a value of importance to each characteristic. It provides interpretability by quantifying the contribution of each feature to the prediction. A comprehensive picture of feature contributions and accompanying justifications for specific forecasts are provided by Integrated Gradients.
9. Model Distillation
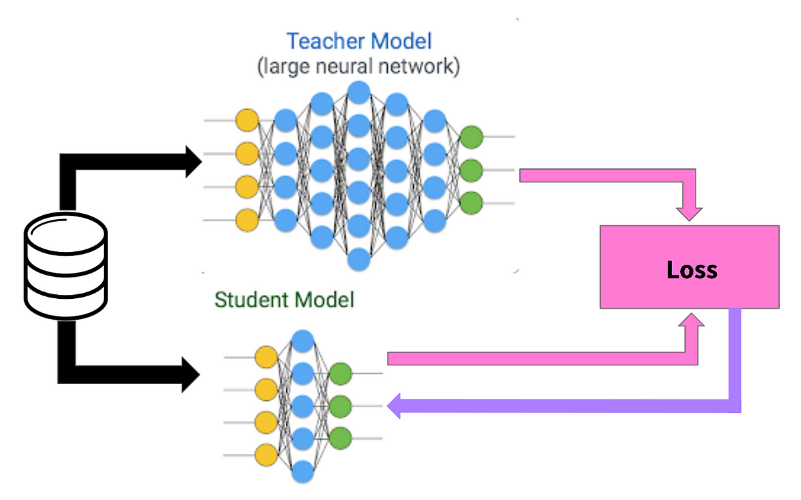
Model distillation is teaching a more basic model—like a linear one—to behave like that of a more sophisticated model. The simplified model’s interpretability is retained in the distilled model, which approximates the complicated model’s predictions. Model distillation offers a straightforward substitute for comprehending model decisions when complicated models, such as deep neural networks, are challenging to analyze directly.
10. Counterfactual Explanations
Alternative input situations produced by counterfactual explanations result in various model predictions. Stakeholders can comprehend the model’s decision boundaries and investigate how altering inputs might affect the results by offering these “what-if” explanations. By letting people recognize the adjustments to the input variables that must be made to get the intended results, counterfactual explanations improve interpretability.
