HOW to copy entered numbers in text to MS excel automatically

Asked By 10 points N/A Posted on -
qa-featured

I have a hardware unit which logs the values from a FPS receiver every second in some standard format. The logging happens in text file. Every time I want to see the data, I have to manually copy the columns one by one and paste it into MS Excel. And then use graph feature to analyze the results. I am a average knowledge of programming but, I am failing here completely. I want MSexcel to automatically read the text file which is being updated by the hardware unit. I know this is an interesting application yet powerful and difficult. But, if that is possible my next step will be to automatically update the graph every second, based on a text file.

SHARE
Answered By 0 points N/A #194233

HOW to copy entered numbers in text to MS excel automatically

qa-featured

Hello Katharine,

With these steps, you are assured to eliminate every need to finish any charts, graphs, and tables as well as updating them manually. I know it is everyone’s dream to find the simplest way to keep all tables, charts, and graphs automatically updating themselves when you input reports and data into MS Excel 2007, 2010 or 2013 file and save yourselves unimaginable length of time. The followings are the steps to follow:

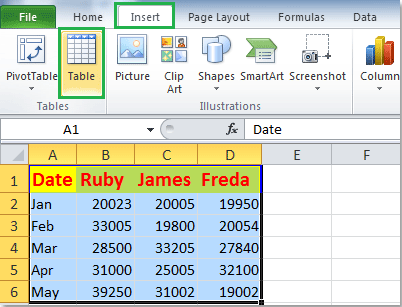
1. Under the Insert Tab, click to select table after selecting the data range.

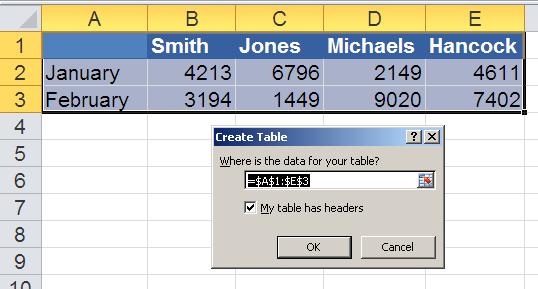
2. Excel will display Create Table dialog box which is subject to change. Be mindful to uncheck the My table has headers option if your table does not contain headers.

3. Click on OK for Excel to format the data range as table.

4. By formulating the sumifs and nesting them in the if formulas automatically enable the table to power the graph.

5. Define with named range the sequential values in the graph.

6. Define the named ranges with offset and count formulas.

To explain further is an example of the formulas

  • Formula (abridged) from cell B3
  • SUMIFS(‘Data For Our Graph’!$D:$D,’Data For Our Graph’!$B:$B,’Automated Graph’!B$2)

See that this formula is nested into the if formula to check the sumifs from returning a zero as well as replacing it with empty text string rather.

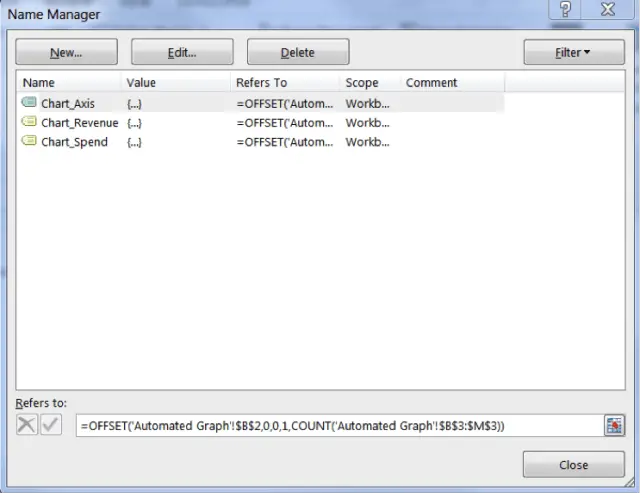
7. Progress to a named range (an example: Chart Axis) using a formula thus taking advantage of the offset formulas and count formulas to define it. Example =OFFSET(‘Automated Graph’!$B$2,0,0,1,COUNT(‘Automated Graph’!$B$3:$M$3))

8. Make a named range for our graph’s axis likewise every single one of its series. The axis, spend, and revenue values form the three ranges.

9. Remember to define the axis value last to avoid the MS Excel from redefining the axis values if each of the series has several shape. However, with the named ranges, define the series and axis in the graph to finalize the automation of this process.

Bear in mind that this very steps can be employed in creating graph being a rolling data set using the second and third guidelines in the offset function. I wish you and your team all the best.

Brenda Cruise

Related Questions