How to make chart in excel?
I have heard that charts are able to create in Microsoft excel easily. I tried to make a chart.
However, it was not successful. Can anyone explain me to make a chart with an example?
Thanks.
I have heard that charts are able to create in Microsoft excel easily. I tried to make a chart.
However, it was not successful. Can anyone explain me to make a chart with an example?
Thanks.
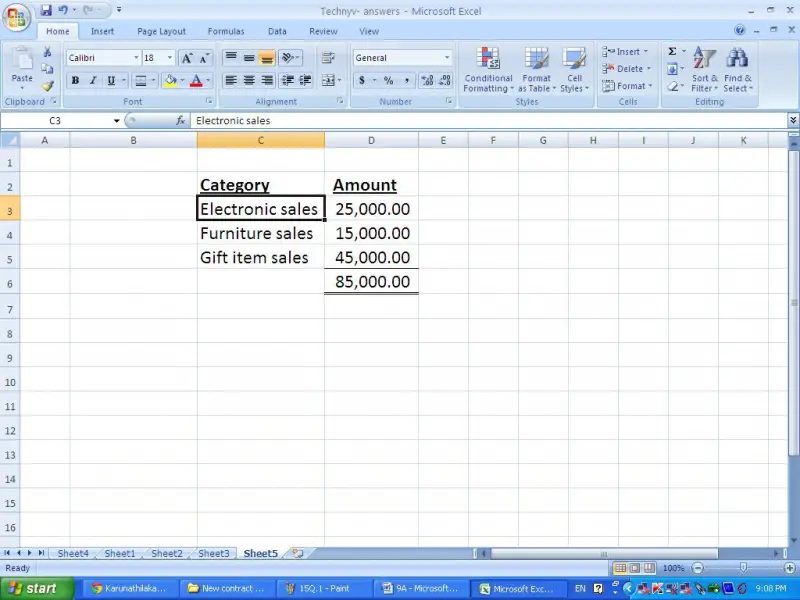
I will explain you how to make a chart in Microsoft excel. I will take following data as an example in order to explain the answer. Look at this image.
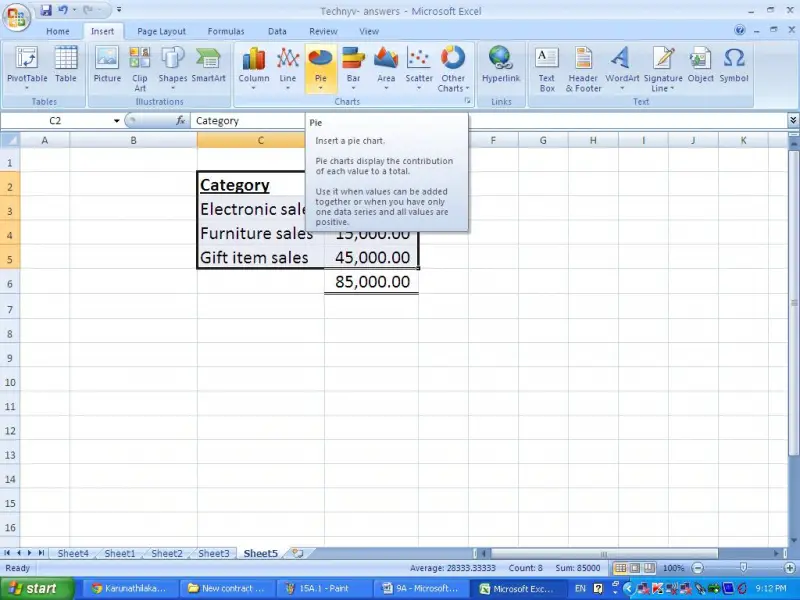
First select the entire set of data including headings except total.
Then click on the insert tab. Now you can see there are many types of chart available in the chart section.
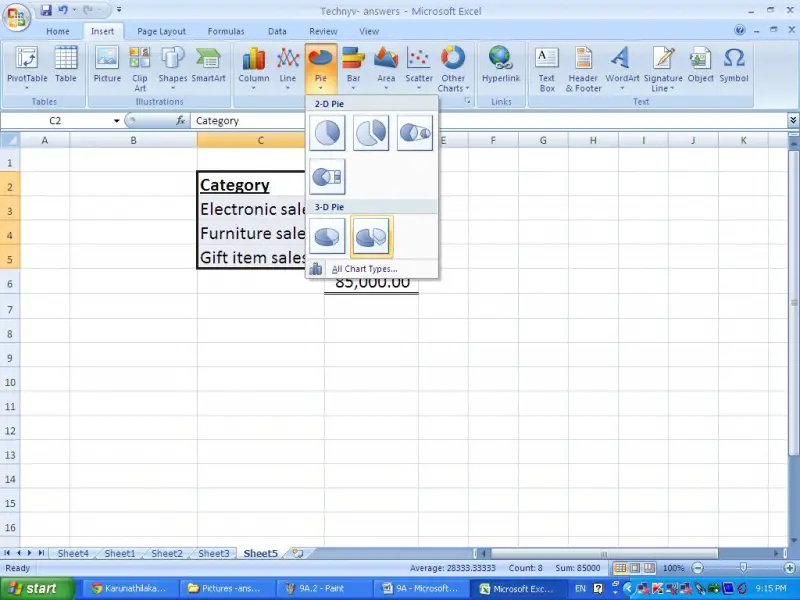
Please select a type as you want. I will select pie chart type.
Then select 2D- pie or 3D- pie chart as you wish. I will select 3D – Pie category and click on that.
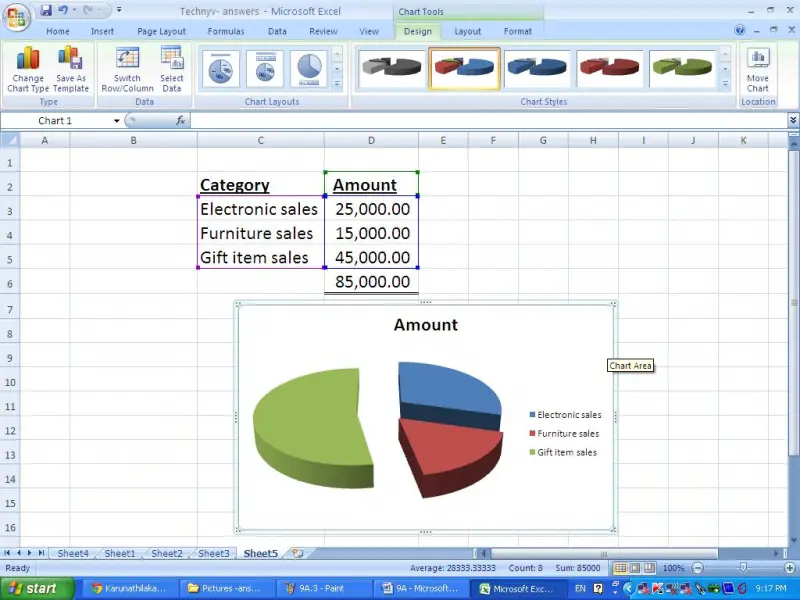
Then the pie chart will be displayed as follows.
As such you can create any types of chart in Microsoft excel.
Thanks.
It actually depends on what chart you want. There are actually a lot of charts to choose from like column, line, pie, bar, area, scatter and other charts. To make a chart, here’s what you should do.
1. Make a table which contains data. It should have headings.
Heading 1Â Â Â Â Â Â Â Â Â Â Heading 2 Â Â Â Â Â Â Â Â Â Â Heading 3
Data1Â Â Â Â Â Â Â Â Â Â Â Â Â Â Â Â Â Â Â Â Data2Â Â Â Â Â Â Â Â Â Â Â Â Â Â Â Â Â Â Data3
Data4Â Â Â Â Â Â Â Â Â Â Â Â Â Â Â Â Â Â Â Â Data5Â Â Â Â Â Â Â Â Â Â Â Â Â Â Â Â Â Â Data6
2. Then highlight the entire table that you made.
3. Click on the Insert tab. Then click on Charts.
4. Setup the chart so that the data that appears on the chart are the ones you need.
5. Then follow the directions and you’re done.
Hope this helps.