Making charts in SharePoint 2010 law office template
Need to present a data in a diagram format. For this purpose, I need to make some charts. How can I make charts in SharePoint 2010 law office template?
Hi Jeff feinberg,
For you to create static or dynamic charts for your law office site without having to hard code them, you will have to make use of Microsoft SharePoint's Chart Web Part (CWP). CWP allows you present information from Excel documents and display them in a graphical way. Below are the steps for adding charts via CWP:
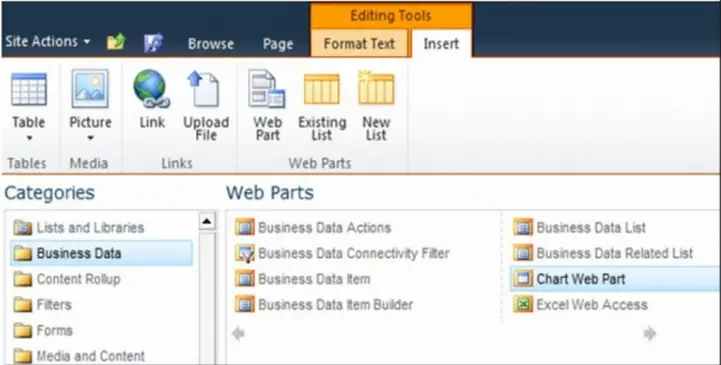
1. To drop CWP on your website page: Go to Site Actions > Edit Page.
2. Click Insert in the Editing Tools' menu.
3. Go to Business Data category > Click Chart Web Part and add to a content area.
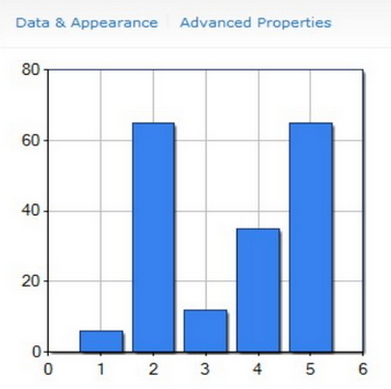
4. Data & Appearance and Advance Properties options will be visible once CWP is added to the page.
5. Click Data & Appearance to customize or connect a data source for the chart.
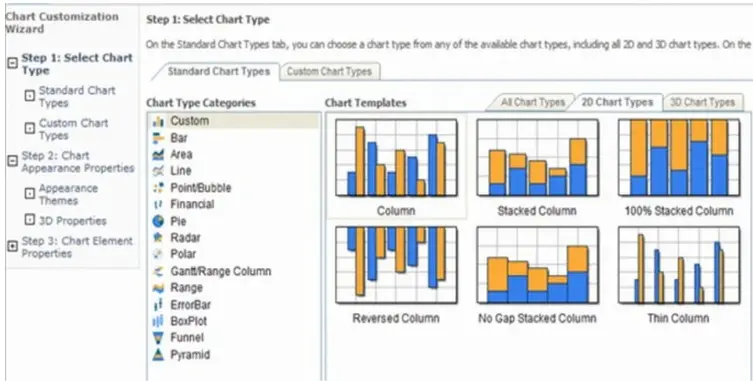
6. The Customize Your Chart option will help you format the appearance properties of your chart.
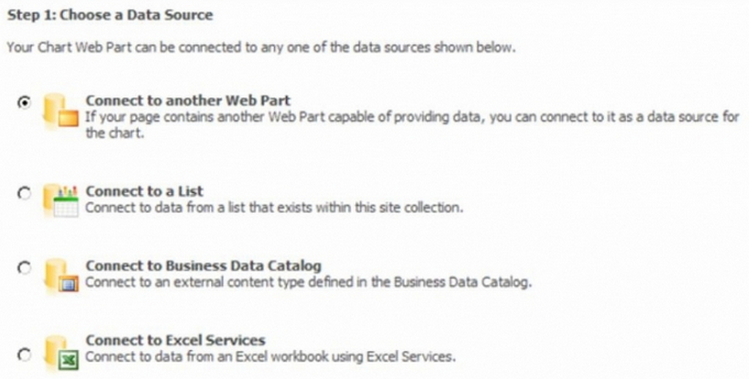
7. Connect Chart To Data option will specify which data source will be used for the chart. You can connect your CWP to another web part, to a list, to a business catalog or to an Excel workbook.
It is up to you to decide how to modify the various options to change the properties and styles of your chart, until you get your desired results. The steps are definitely very straightforward and easy to follow.