How can I use Microsoft excel to compute ANOVA computations? I have a data set that I would like to know how to go about this in excel. Can I use this package to compute correlations too? how do I arrange my data set and what other analysis tools does this package offer?
Using excell to analyse ANOVA computaions of the data
Â
Let me first explain to you the process for computation of single factor ANOVA for excel spreadsheet. Single factor ANOVA which is also known as one-way ANOVA is generally prepared for computation of null hypothesis.
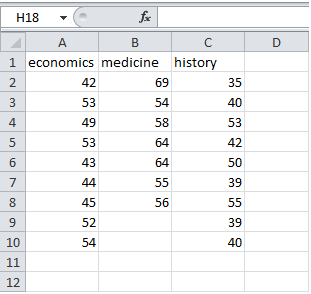
Let's take an example of table below.
 Table shows salaries of teachers with degree in Economics, Medicine and History.
H0: μ1 = μ2 = μ3
H1=Â at least one means is different.
Now for computation of single factor ANOVA we need to perform the below mentioned steps.
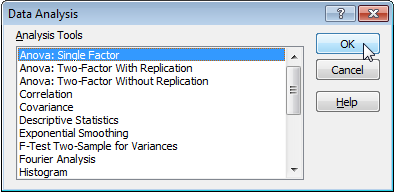
Step I. From the Data tab click to Data Analysis.
Step II Now click Ok to ANOVA:Single Factor as shown in the image below.
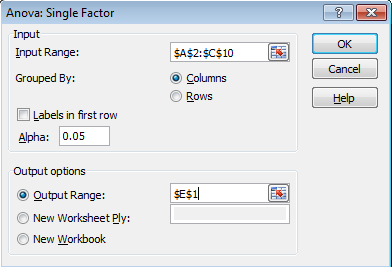
Step III. Now you have to click to the input range box and in this case our input range is A2:C10.
Step IV. Now we need to click output range box to select cell for the output. E.g. I select cell E1.
Step V. Now click Ok.
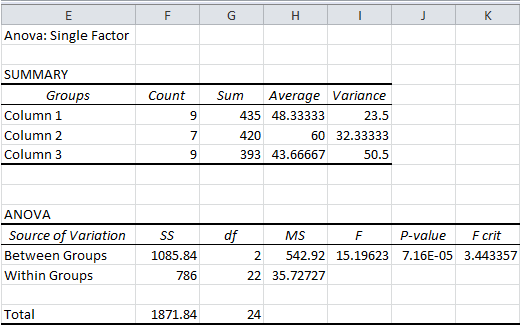
The result will be as follows:
Conclusion: When F>F crit, Null hypothesis is rejected.Here 15.196 is greater than 3.443 and that is why Null hypothesis is rejected. Here means of 3 populations are equal too.