Hello Friends,
I am planning to develop an application in Visual Basic that will receive a .wav file path as input & display the sin graph with frequency and wavelength of the sound in the file. Please guide me about how to start creating Visual Basic sound frequency graph.
Thanks,
Abelina Sophia
Visual Basic sound frequency graph

Direct Sound is a component of DirectX library software and is a mature API. This software can be used with VB.NET to play and visualize WAV files.
Load DirectSound reference in VB.NET project as shown:

This reference adds four basic parts required in your project:
Microsoft.DirectX.DirectSound.Device
Microsoft.DirectX.DirectSound.WaveFormat
Microsoft.DirectX.DirectSound.SecondaryBuffer
Microsoft.DirectX.DirectSound.BufferDescription
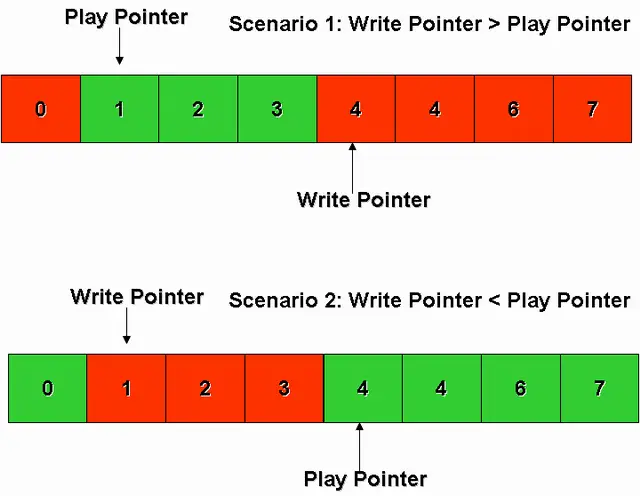
Direct sound uses circular buffers to play sounds. There are two types of circular buffers: static buffer; used for short and repeated sounds and streaming buffer; used for longer sounds like background music.
Playing WAV file using Static buffer:
Create a new sound device (Sound card + Speaker).
Create Secondary buffer and assign a valid WAV file name and an input audio device.
Use play method for Secondary buffer.
Playing WAV file using Circular buffer:

The write pointer specifies location for writing data and play pointer specifies play data location. As the play pointer in first step advances write pointer moves and data has to be continuously added to avoid distortion. In the second step write pointer advances and loops back when reaches 7 and thus data will be played continuously.
To Play selected portions of WAV file
Static buffer can be used to ply portions of WAV file; the portions can be selected using Capture1 and capture2 buttons and playing two parts simultaneously, thus producing mixed sounds.

To visualize WAV file data as a Graph of sound values you can use DrawGraph button. This process can be speeded up using double buffering.


